Gene: SACM1L
chr3: 45730547-45751140Expression Profile
(log scale)
Graphical Connections
Distribution of linked clusters:
You may find it interesting if many of the connected DHS sites belong to the same cluster.| Cluster Profile | Cluster ID | Number of DHS sites in this cluster |
|---|---|---|
 | 2110 | 4 |
 | 430 | 3 |
 | 10 | 2 |
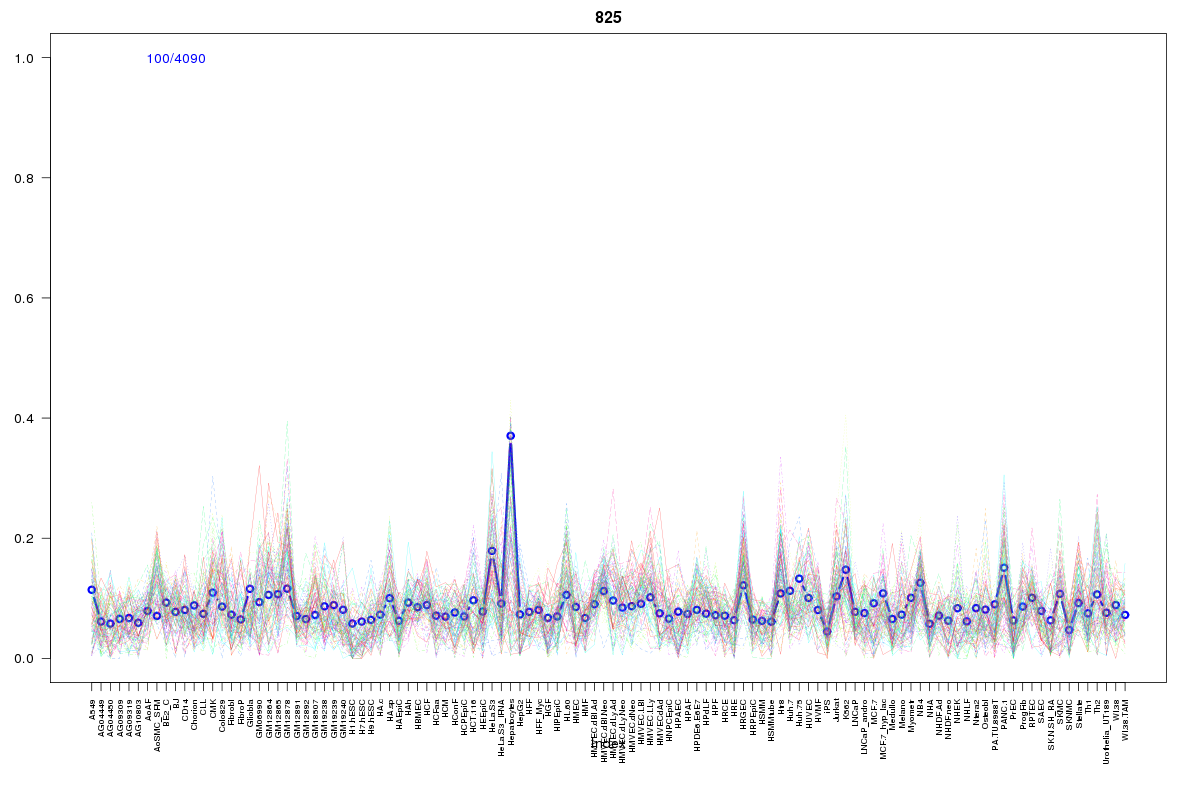 | 825 | 2 |
 | 2055 | 2 |
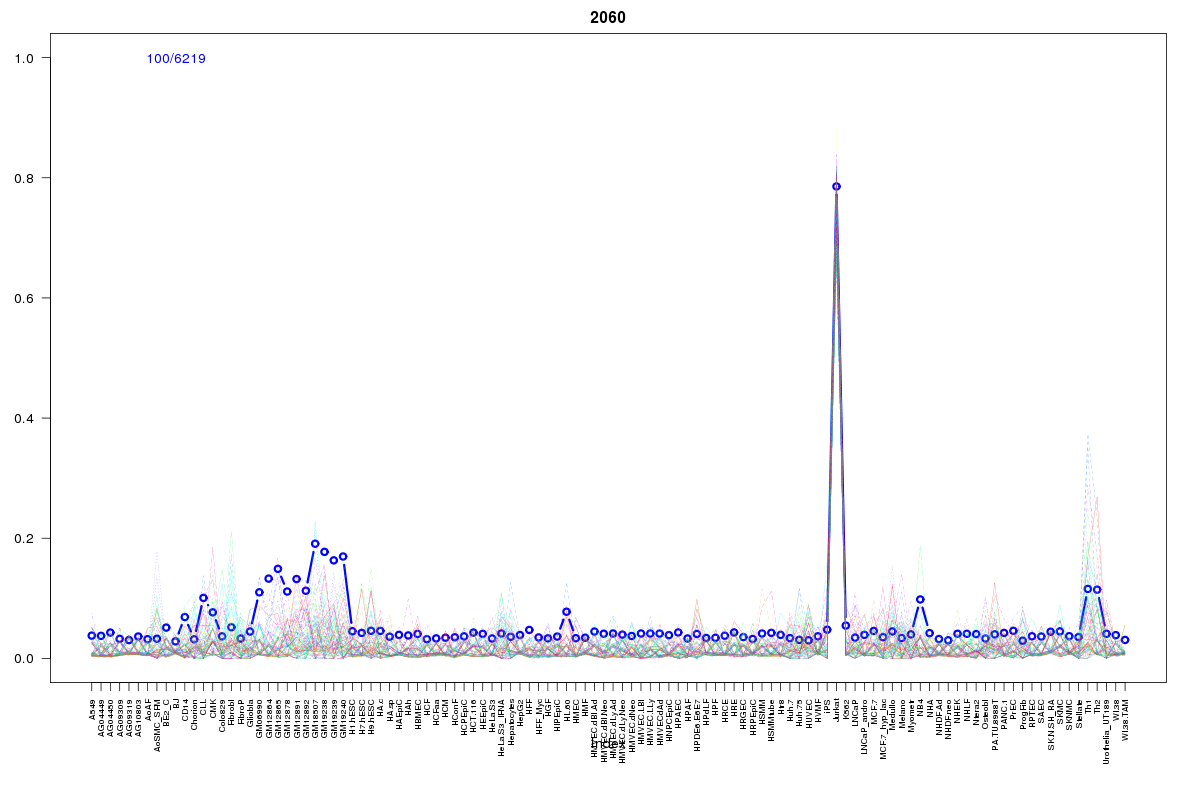 | 2060 | 2 |
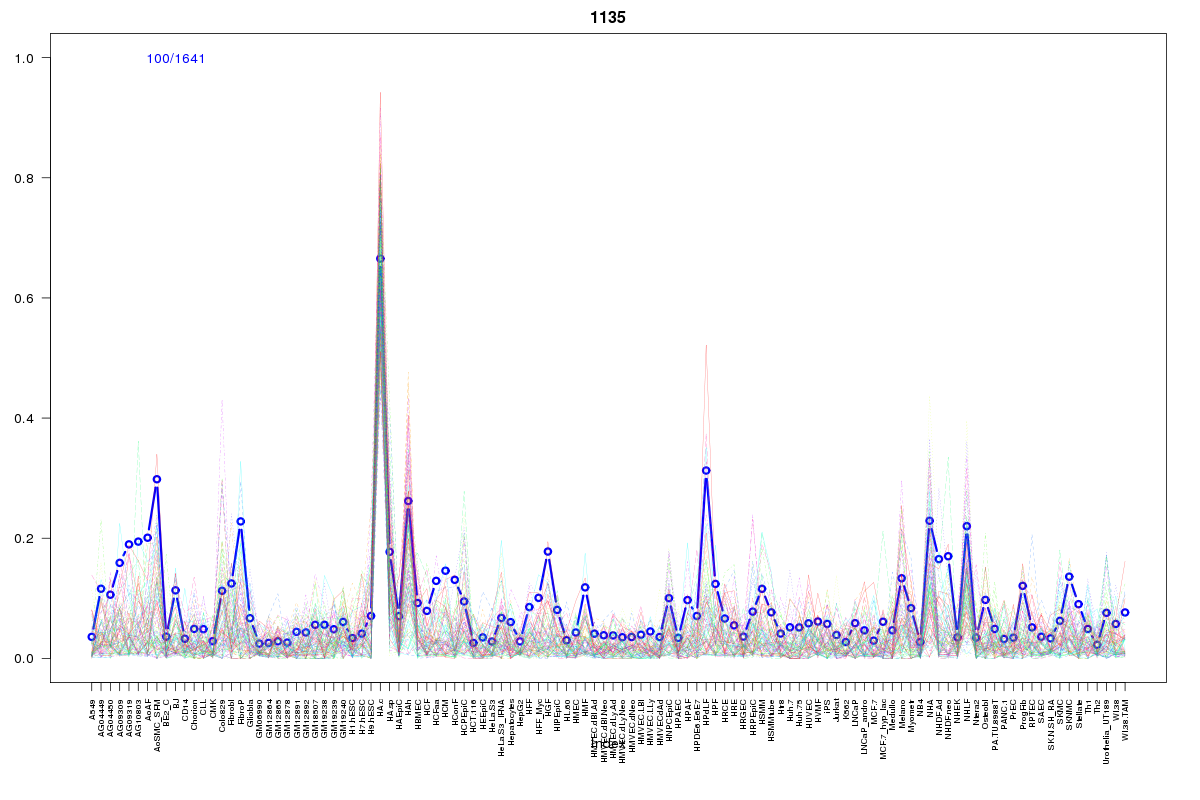 | 1135 | 1 |
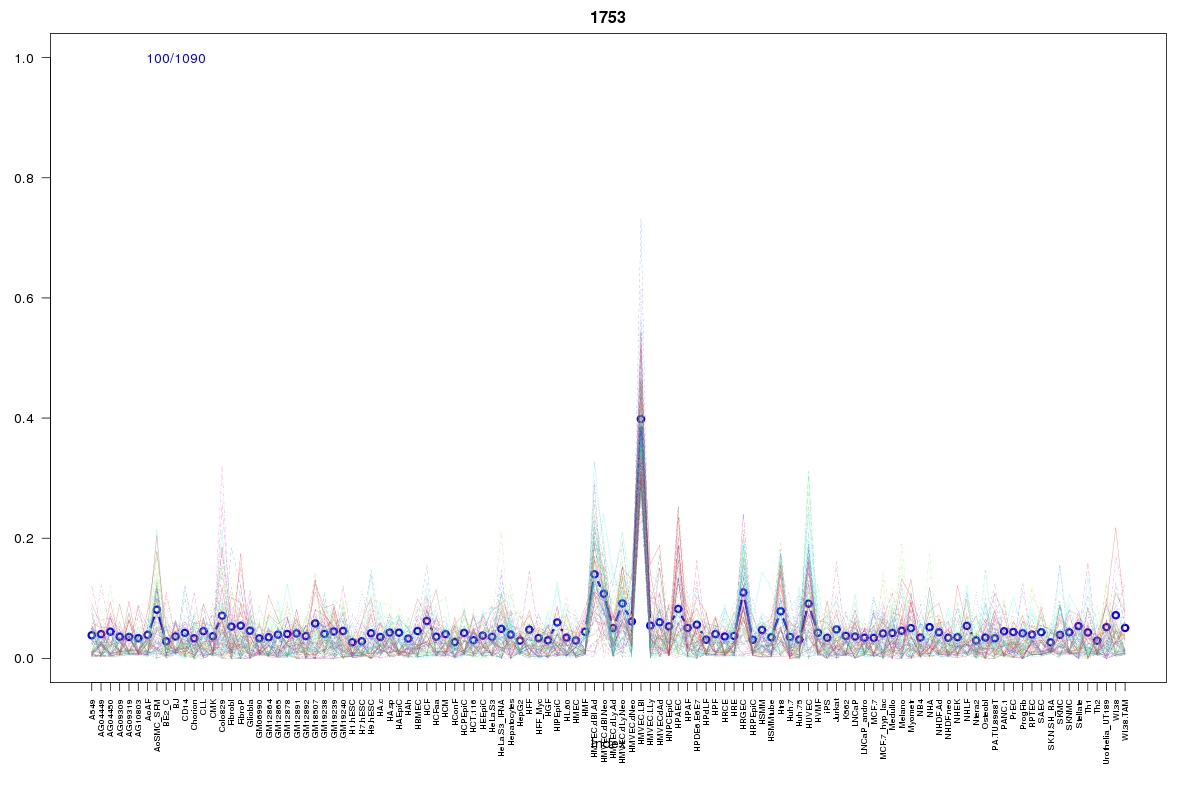 | 1753 | 1 |
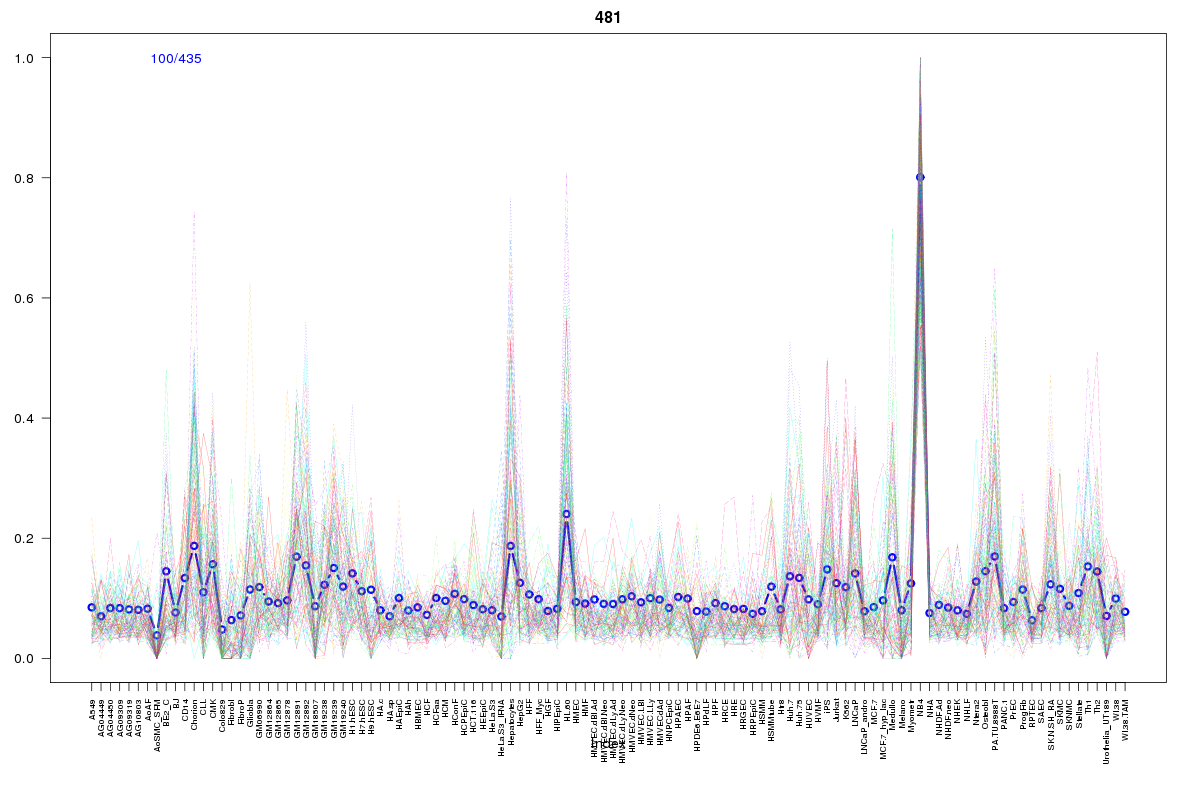 | 481 | 1 |
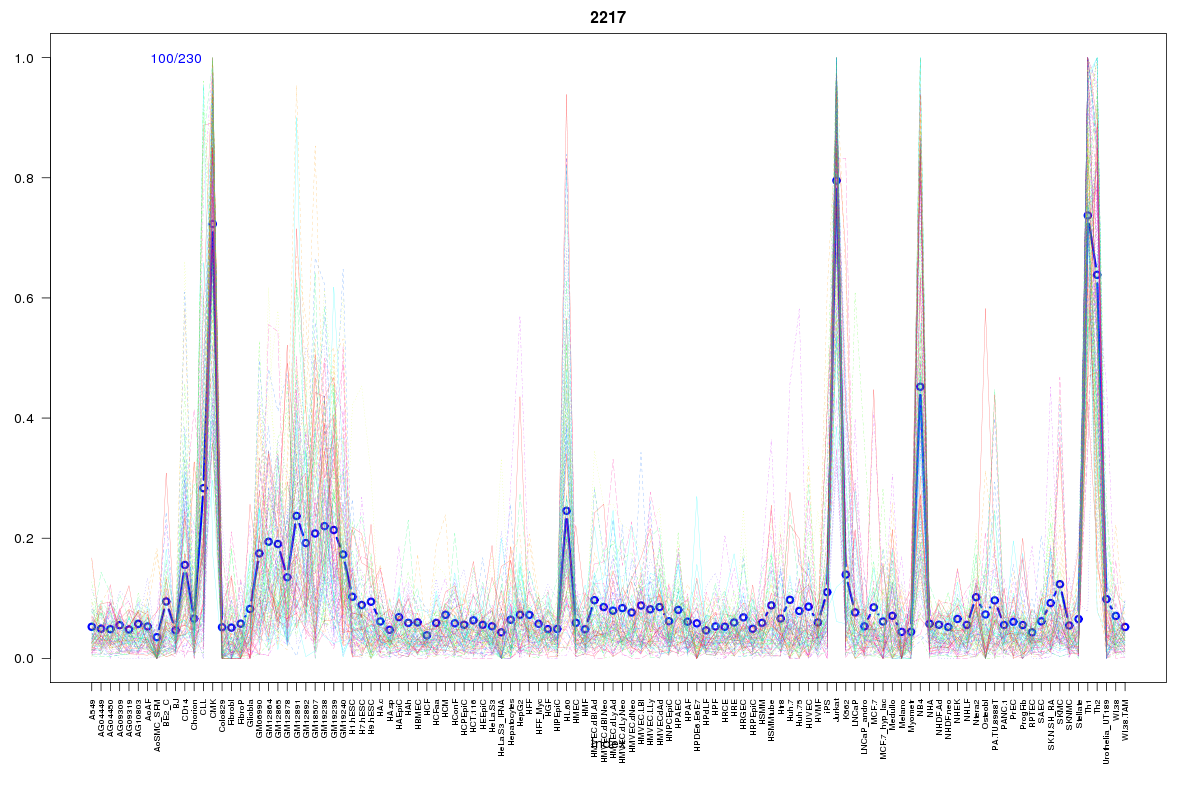 | 2217 | 1 |
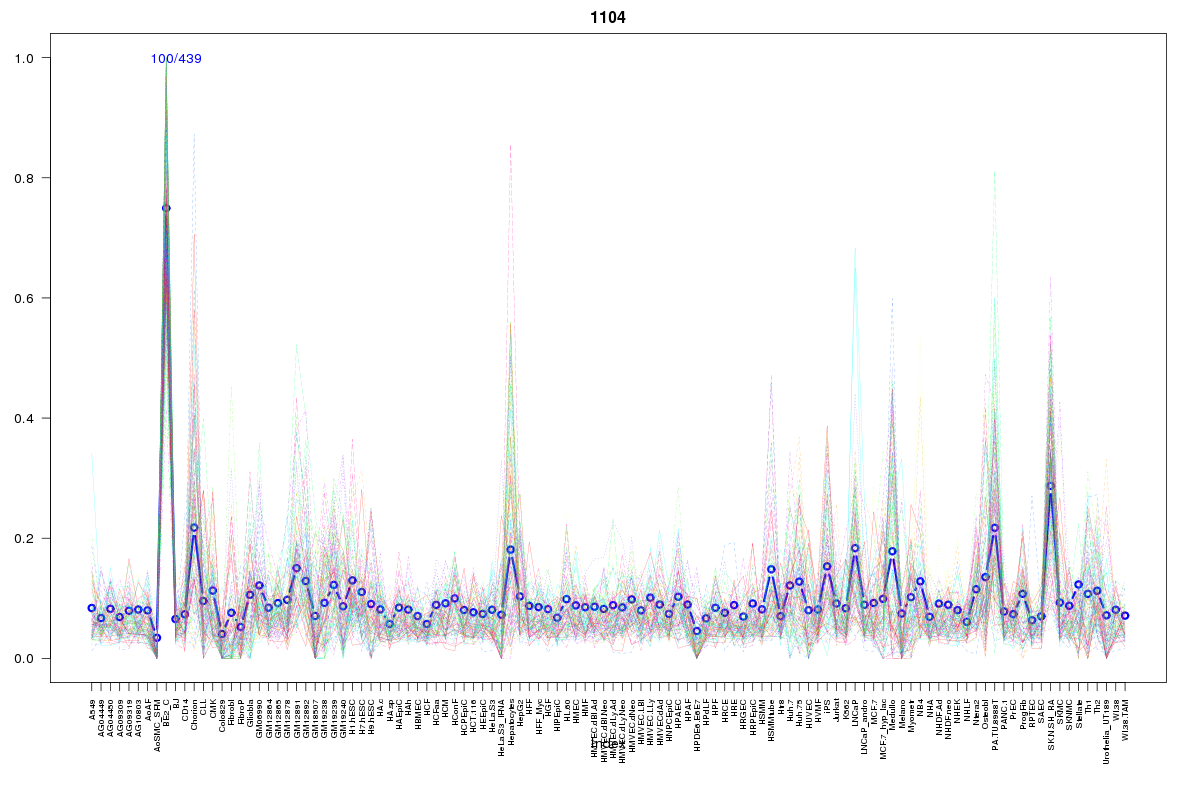 | 1104 | 1 |
 | 2063 | 1 |
 | 860 | 1 |
 | 2114 | 1 |
 | 2052 | 1 |
 | 1075 | 1 |
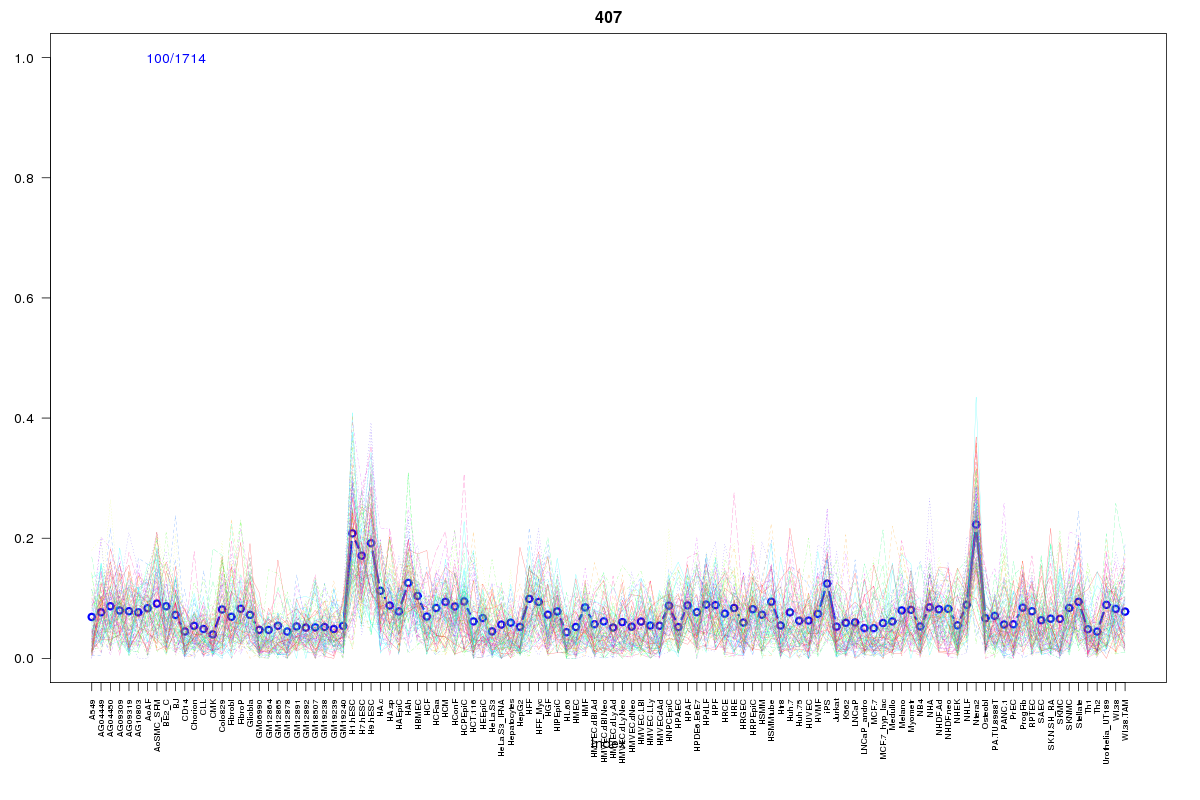 | 407 | 1 |
Resources
BED file downloads
Connects to 26 DHS sitesTop 10 Correlated DHS Sites
p-values indiciate significant higher or lower correlation| Location | Cluster | P-value |
|---|---|---|
| chr3:45732065-45732215 | 825 | 0 |
| chr3:45731900-45732050 | 825 | 0 |
| chr3:45718540-45718690 | 2217 | 0 |
| chr3:45799685-45799835 | 2110 | 0.001 |
| chr3:45814360-45814510 | 2060 | 0.001 |
| chr3:45814125-45814275 | 2114 | 0.001 |
| chr3:45718260-45718410 | 481 | 0.001 |
| chr3:45653480-45653630 | 2110 | 0.007 |
| chr3:45857885-45858035 | 2110 | 0.008 |
| chr3:45839685-45839835 | 2055 | 0.008 |
| chr3:45735500-45735650 | 2063 | 0.008 |
External Databases
UCSCEnsembl (ENSG00000211456)