SOM cluster: 1135
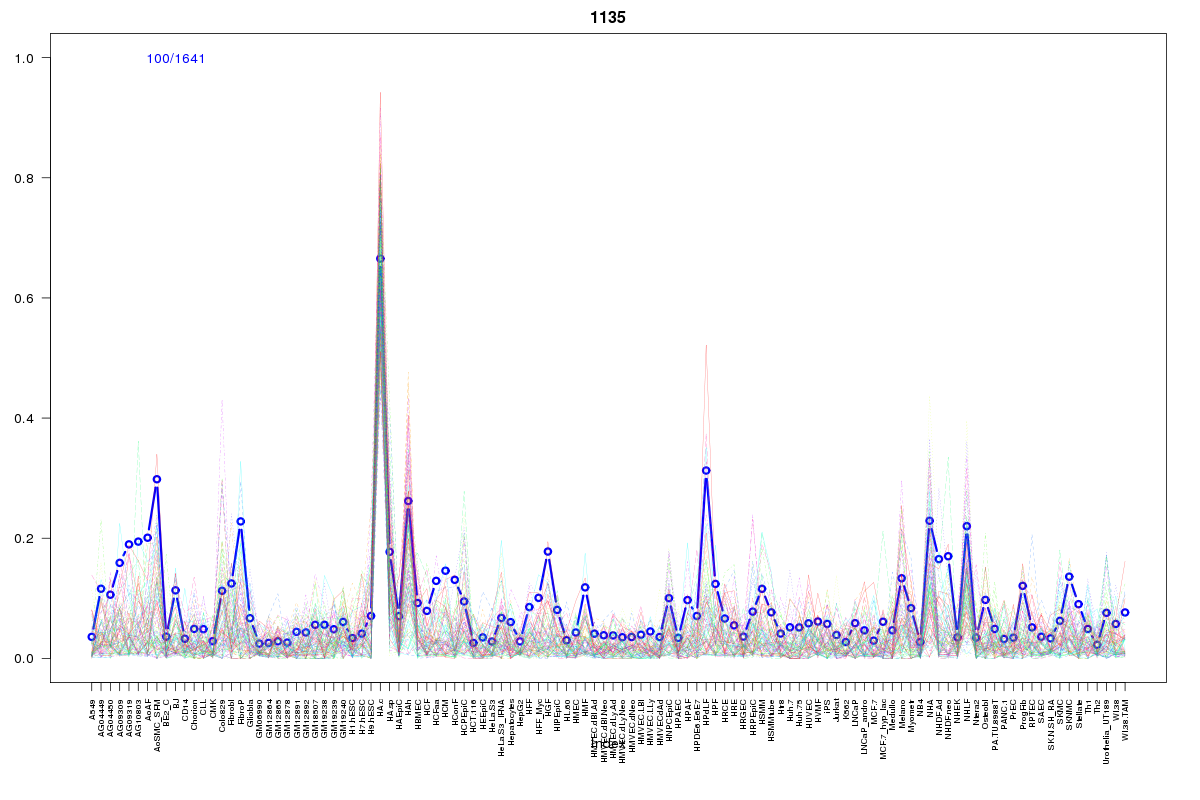
Cluster Hypersensitivity Profile

Genomic Location Trend
These plots show the distribution of the DHS sites surrounding the Transcript Start Site of the nearest gene.
Stats
Number of sites: 1641Promoter: 0%
CpG-Island: 0%
Conserved: 42%
Enriched Motifs & Matches
Match Detail: [Jaspar]
|
| ||
|---|---|---|
| Sites: 25/100 | e-val: 0.00082 | ||
| Factor | e-val(match) | DB |
| RUNX1 | 0.0000093735 | JASPAR |
| ZNF354C | 0.0029098 | JASPAR |
| RREB1 | 0.0073642 | JASPAR |
| Tcfcp2l1 | 0.035525 | JASPAR |
| MYC::MAX | 0.042637 | JASPAR |
BED file downloads
Top 10 Example Regions
| Location | Gene Link | Dist. |
|---|---|---|
| chr21: 27211280-27211430 | GABPA | 51.64 |
| chr4: 166364560-166364710 | CPE | 56.52 |
| chr13: 108114220-108114370 | FAM155A | 57.13 |
| chr7: 37963985-37964135 | SFRP4 | 59.17 |
| chr5: 170842420-170842570 | FGF18 | 59.48 |
| chr7: 130780240-130780390 | RNU6-1010P | 60.59 |
| chr10: 17386360-17386510 | ST8SIA6 | 61.07 |
| chr12: 63077865-63078015 | MON2 | 61.41 |
| chr12: 63077865-63078015 | MIRLET7I | 61.41 |
| chr22: 42625620-42625770 | TCF20 | 63.3 |