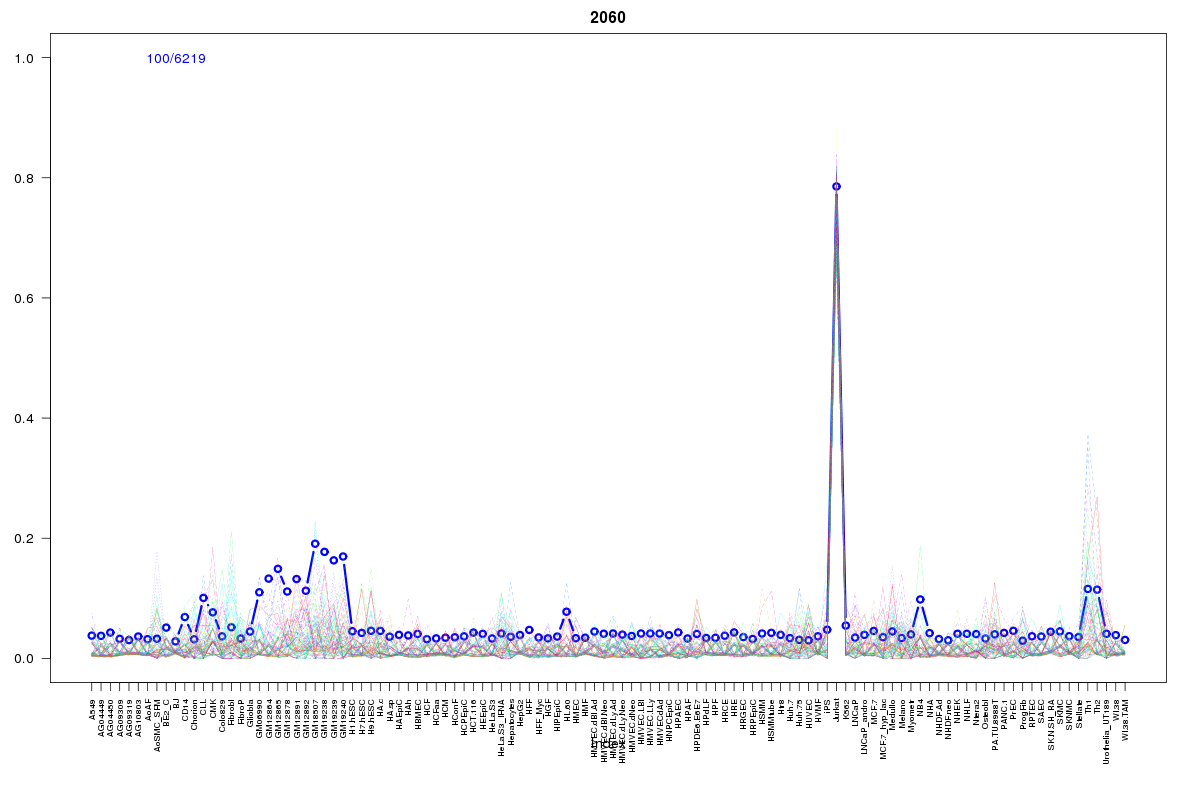
SOM cluster: 2060
Cluster Hypersensitivity Profile

Genomic Location Trend
These plots show the distribution of the DHS sites surrounding the Transcript Start Site of the nearest gene.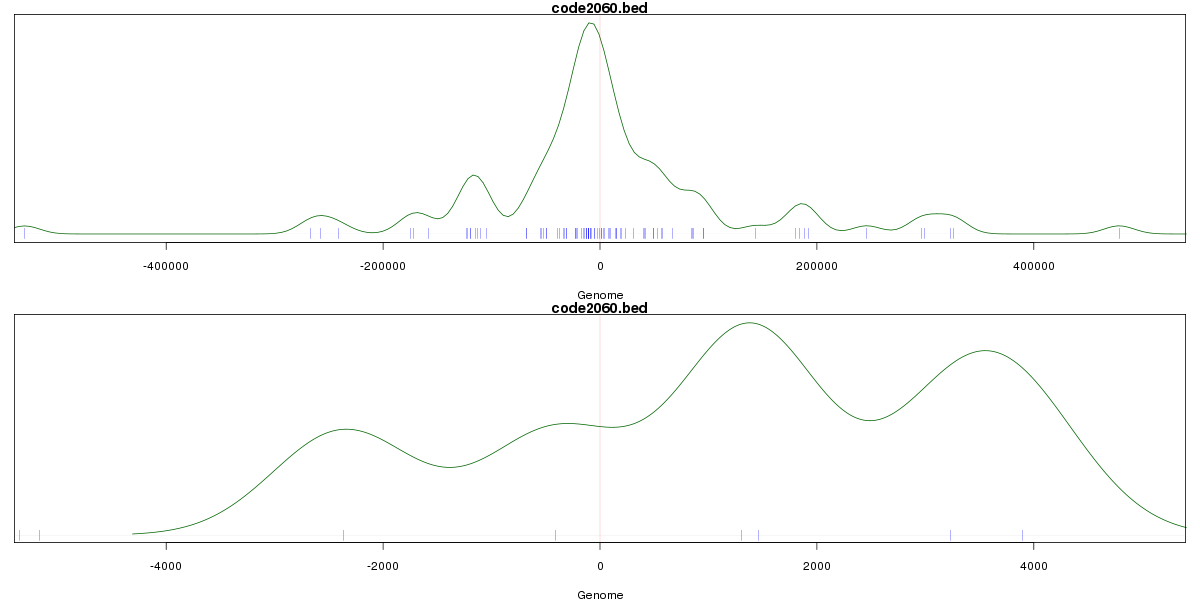
Stats
Number of sites: 6219Promoter: 1%
CpG-Island: 0%
Conserved: 17%
Enriched Motifs & Matches
Match Detail: [Jaspar]
|
| ||
|---|---|---|
| Sites: 11/100 | e-val: 0.0034 | ||
| Factor | e-val(match) | DB |
| Foxd3 | 0.000048883 | JASPAR |
| FOXI1 | 0.00089175 | JASPAR |
| IRF1 | 0.005948 | JASPAR |
| FOXA1 | 0.0064601 | JASPAR |
| Foxq1 | 0.0094767 | JASPAR |
BED file downloads
Top 10 Example Regions
| Location | Gene Link | Dist. |
|---|---|---|
| chr1: 91239480-91239630 | BARHL2 | 20.57 |
| chr1: 91239480-91239630 | RP4-665J23.1 | 20.57 |
| chr1: 149914840-149914990 | SF3B4 | 31.04 |
| chr10: 13690540-13690690 | RP11-295P9.3 | 32.73 |
| chr10: 13690540-13690690 | PRPF18 | 32.73 |
| chr1: 180915300-180915450 | STX6 | 38.53 |
| chr1: 180915300-180915450 | RP11-46A10.5 | 38.53 |
| chr16: 74416520-74416670 | NPIPB15 | 38.96 |
| chr1: 198928645-198928795 | RP11-16L9.3 | 39.48 |
| chr2: 136348620-136348770 | AC064850.4 | 40.65 |