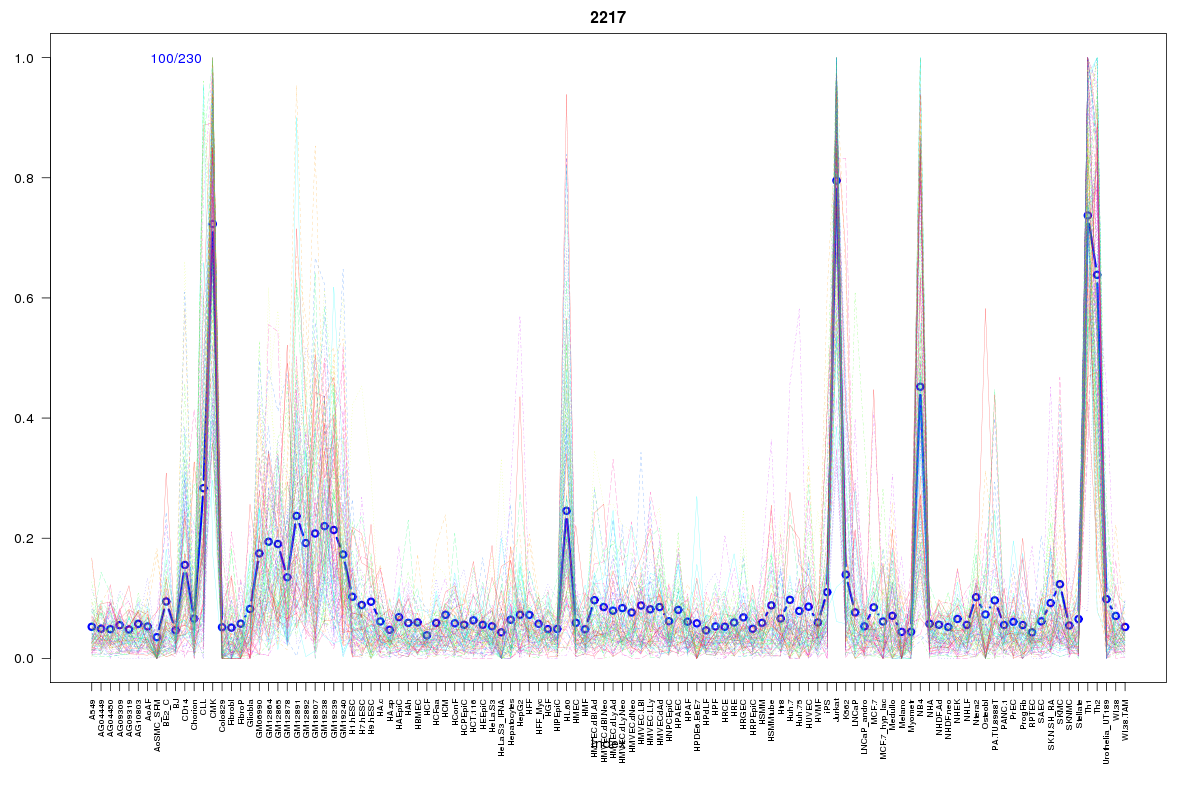
SOM cluster: 2217
Cluster Hypersensitivity Profile

Genomic Location Trend
These plots show the distribution of the DHS sites surrounding the Transcript Start Site of the nearest gene.
Stats
Number of sites: 230Promoter: 5%
CpG-Island: 1%
Conserved: 40%
Enriched Motifs & Matches
Match Detail: [Jaspar]
|
| ||
|---|---|---|
| Sites: 78/100 | e-val: 0 | ||
| Factor | e-val(match) | DB |
| FEV | 0.0000000029372 | JASPAR |
| SPI1 | 0.0000000082219 | JASPAR |
| GABPA | 0.0000011466 | JASPAR |
| ELF5 | 0.0000097638 | JASPAR |
| ELK4 | 0.000019587 | JASPAR |
|
| ||
| Sites: 38/100 | e-val: 1.7e-18 | ||
| Factor | e-val(match) | DB |
| RREB1 | 0.0000000013297 | JASPAR |
| SP1 | 0.0000000067417 | JASPAR |
| Pax4 | 0.0000089667 | JASPAR |
| EWSR1-FLI1 | 0.00023142 | JASPAR |
| MZF1_5-13 | 0.0033006 | JASPAR |
BED file downloads
Top 10 Example Regions
| Location | Gene Link | Dist. |
|---|---|---|
| chr13: 103431900-103432050 | TEX30 | 36.45 |
| chr13: 103431900-103432050 | ERCC5 | 36.45 |
| chr9: 130790880-130791030 | NAIF1 | 48.77 |
| chr9: 130790880-130791030 | RP11-203J24.8 | 48.77 |
| chr3: 48694545-48694695 | UQCRC1 | 49.51 |
| chr9: 35649665-35649815 | TPM2 | 56.24 |
| chr9: 35649665-35649815 | SIT1 | 56.24 |
| chr9: 35649665-35649815 | RUSC2 | 56.24 |
| chr9: 35649665-35649815 | CD72 | 56.24 |
| chr9: 35649665-35649815 | ARHGEF39 | 56.24 |