Gene: MIR200B
chr1: 1102483-1102578Expression Profile
(log scale)
Graphical Connections
Distribution of linked clusters:
You may find it interesting if many of the connected DHS sites belong to the same cluster.| Cluster Profile | Cluster ID | Number of DHS sites in this cluster |
|---|---|---|
 | 1078 | 6 |
 | 2279 | 5 |
 | 1008 | 3 |
 | 2122 | 2 |
 | 860 | 2 |
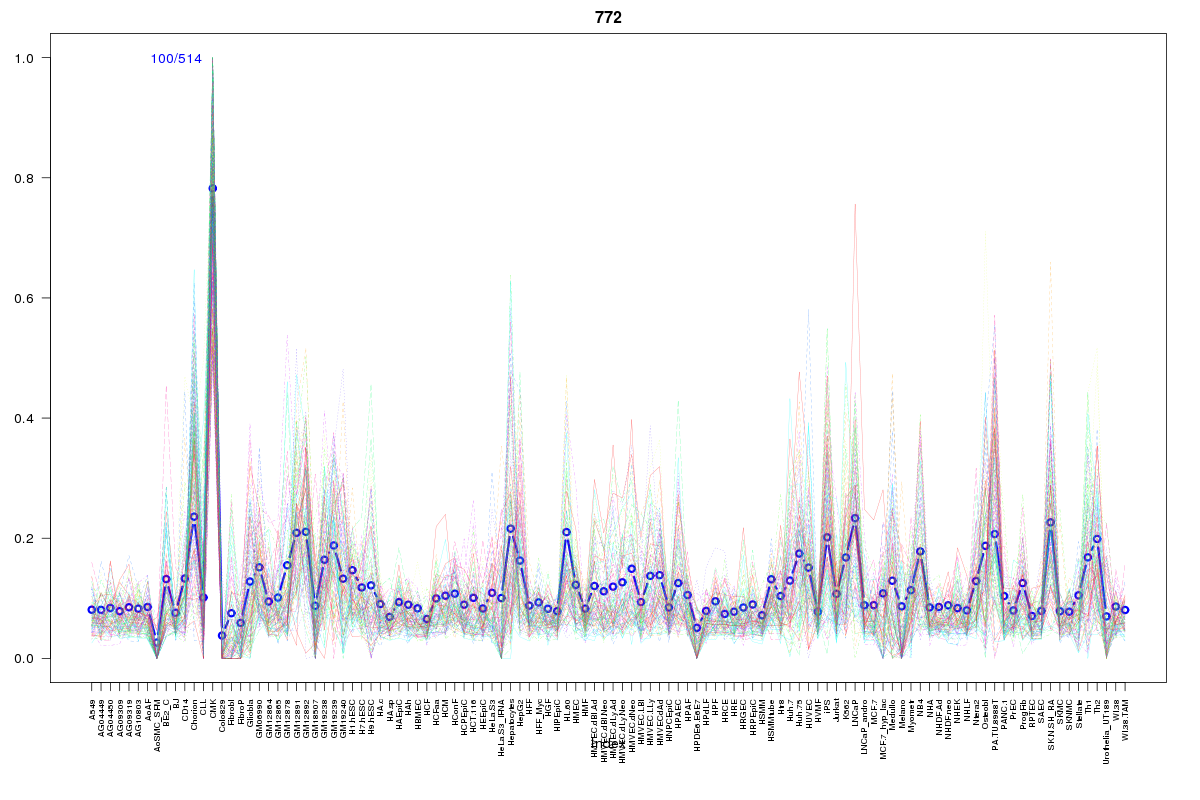 | 772 | 1 |
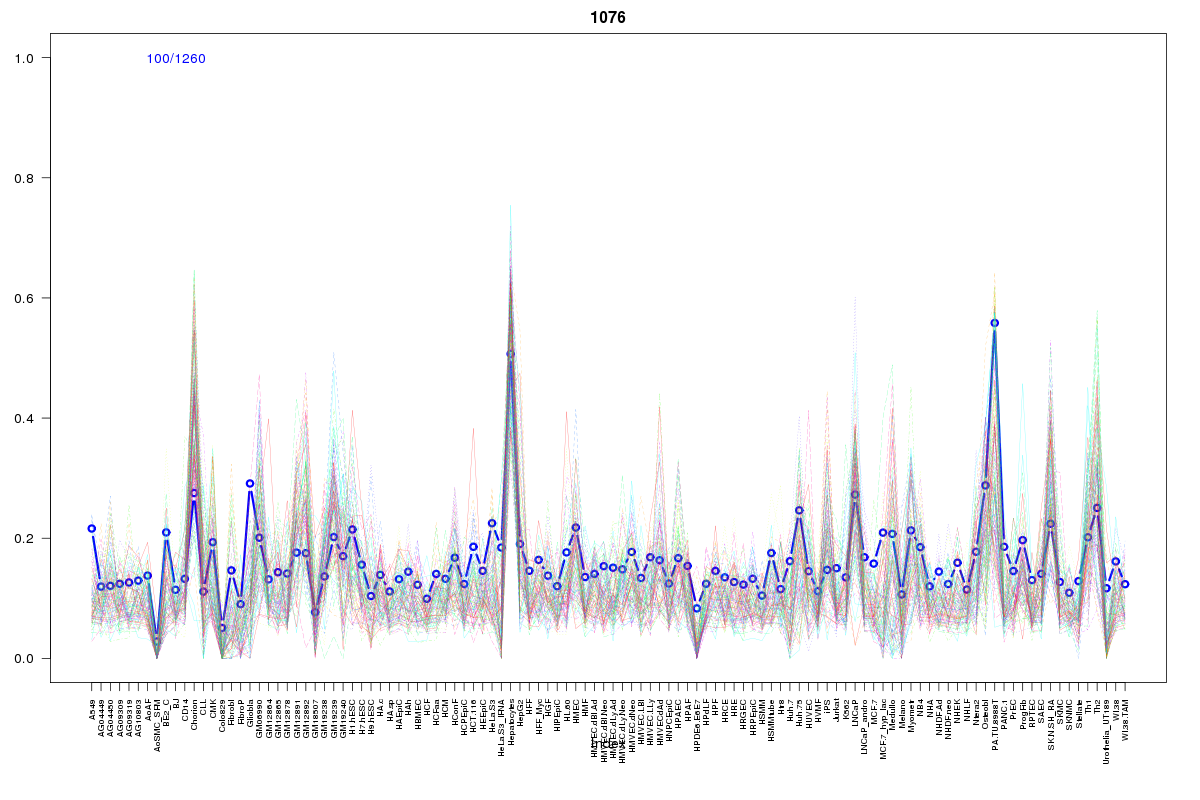 | 1076 | 1 |
 | 881 | 1 |
 | 1225 | 1 |
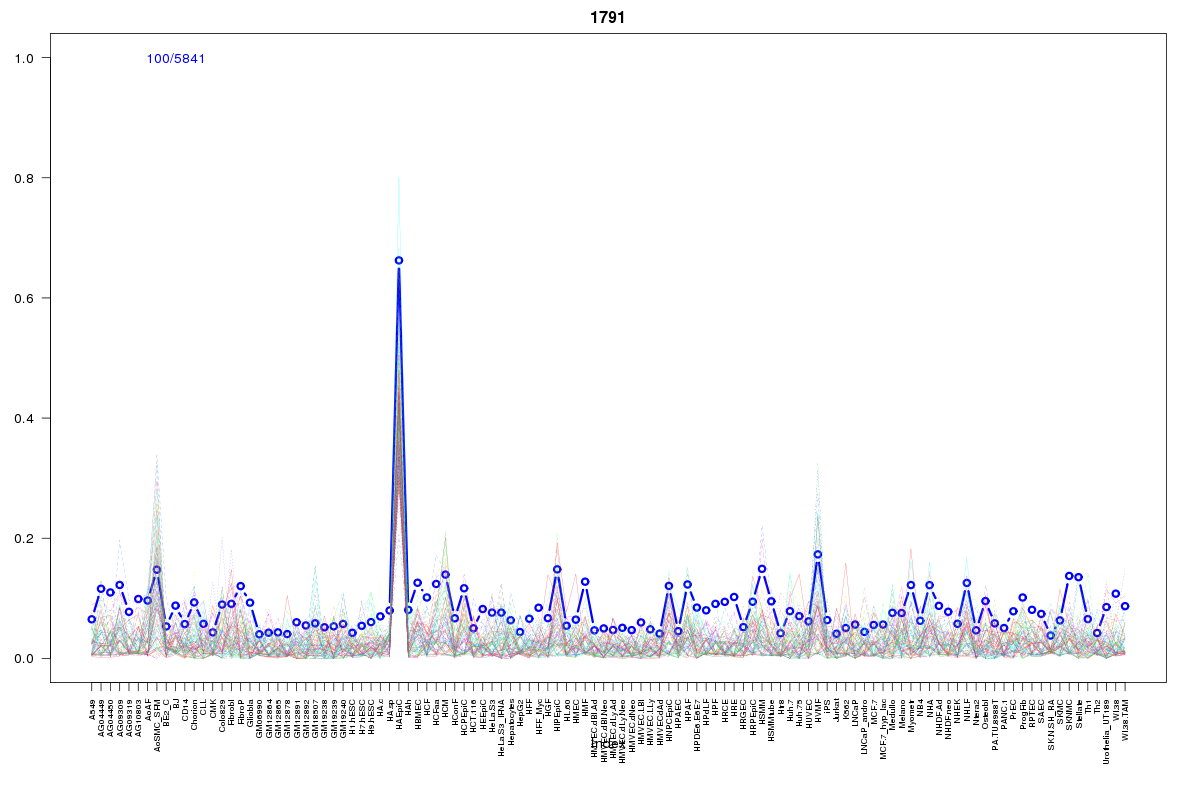 | 1791 | 1 |
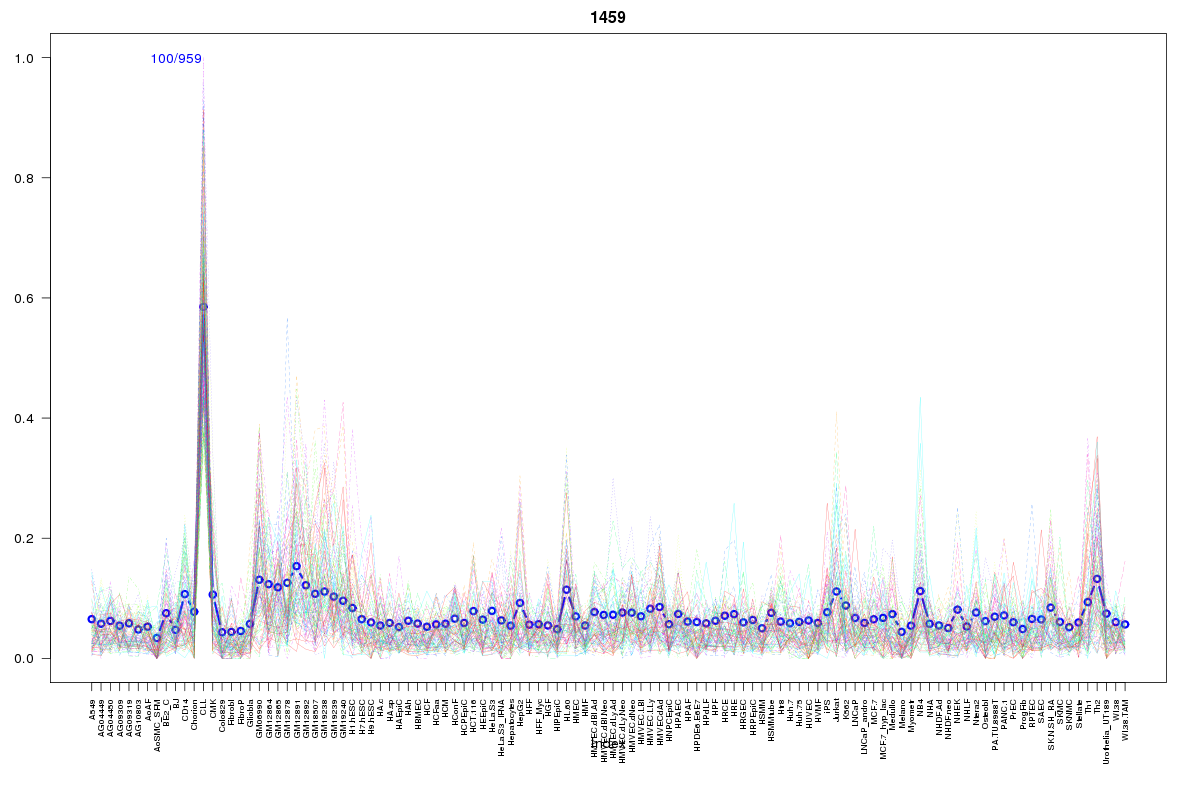 | 1459 | 1 |
 | 1738 | 1 |
 | 430 | 1 |
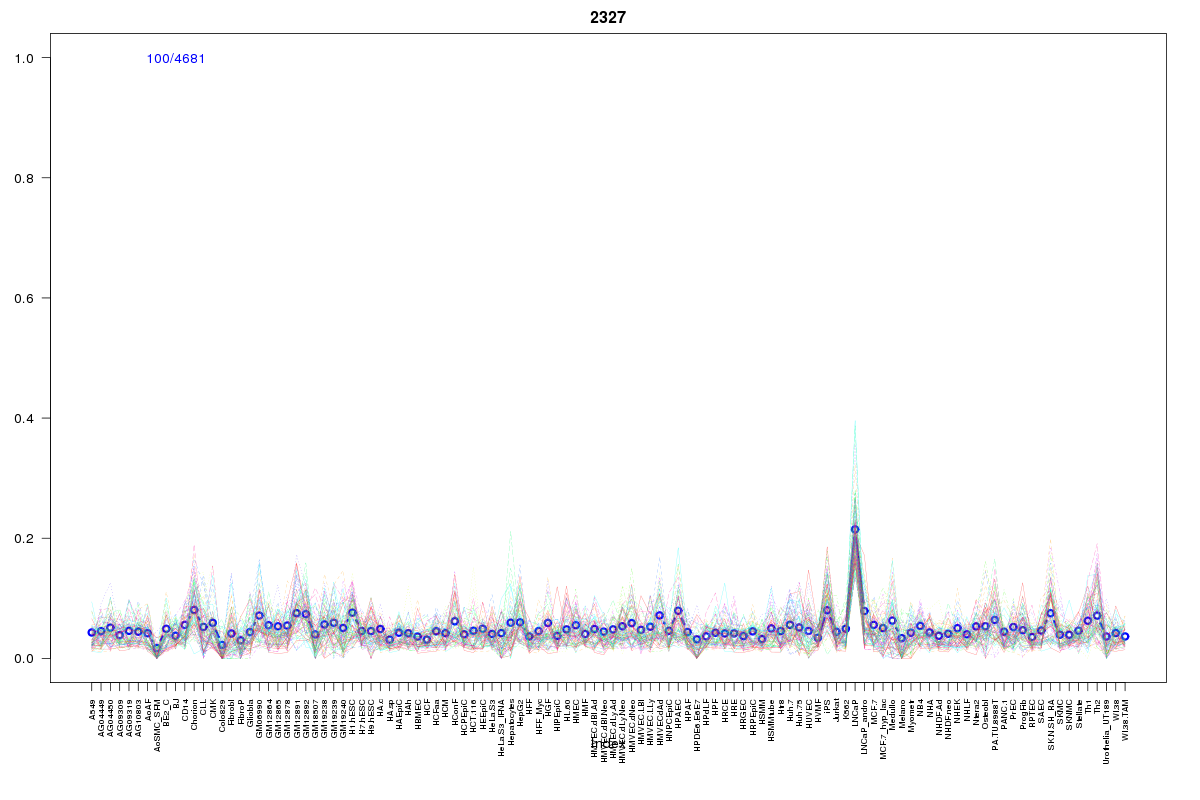 | 2327 | 1 |
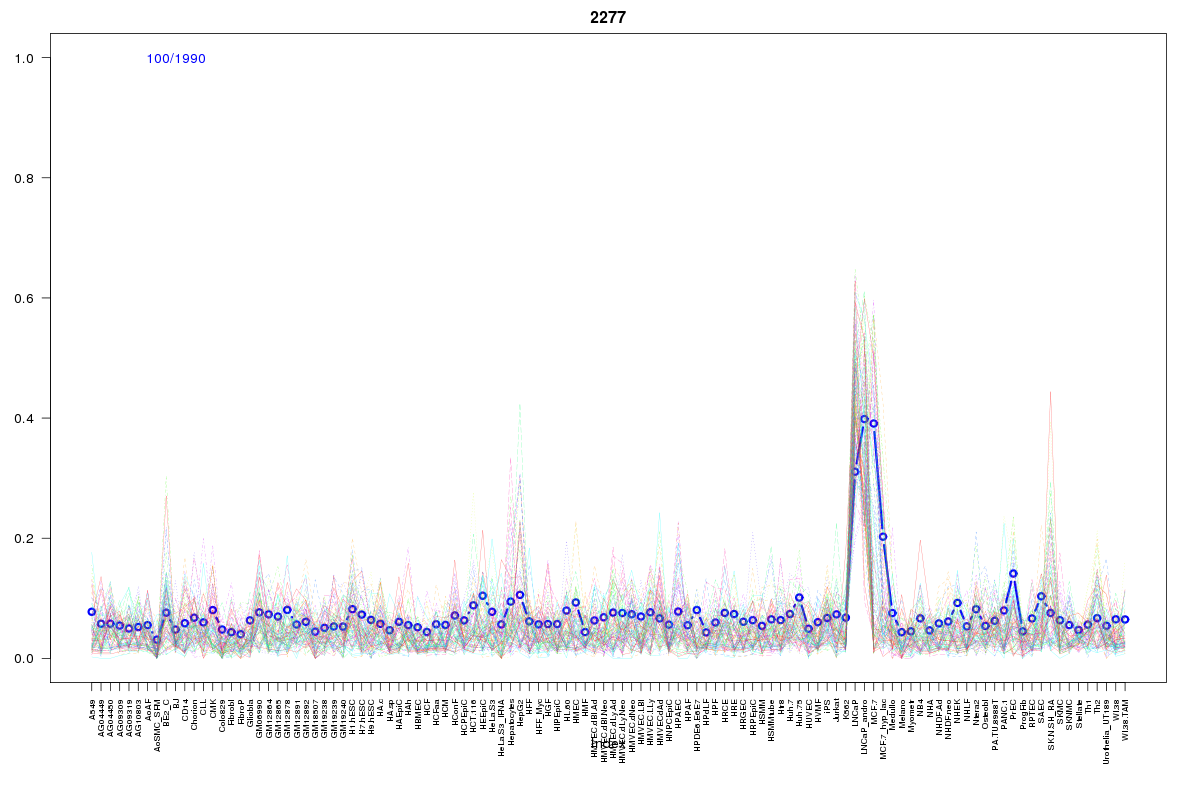 | 2277 | 1 |
 | 582 | 1 |
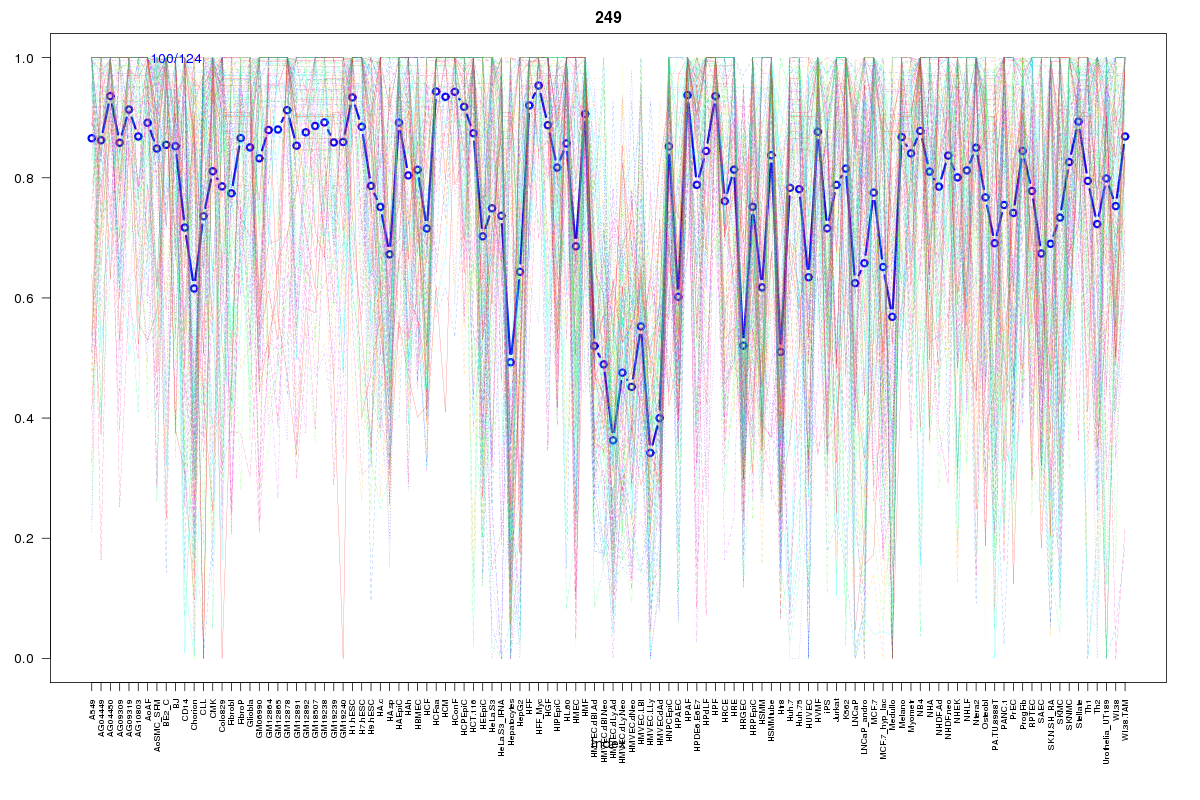 | 249 | 1 |
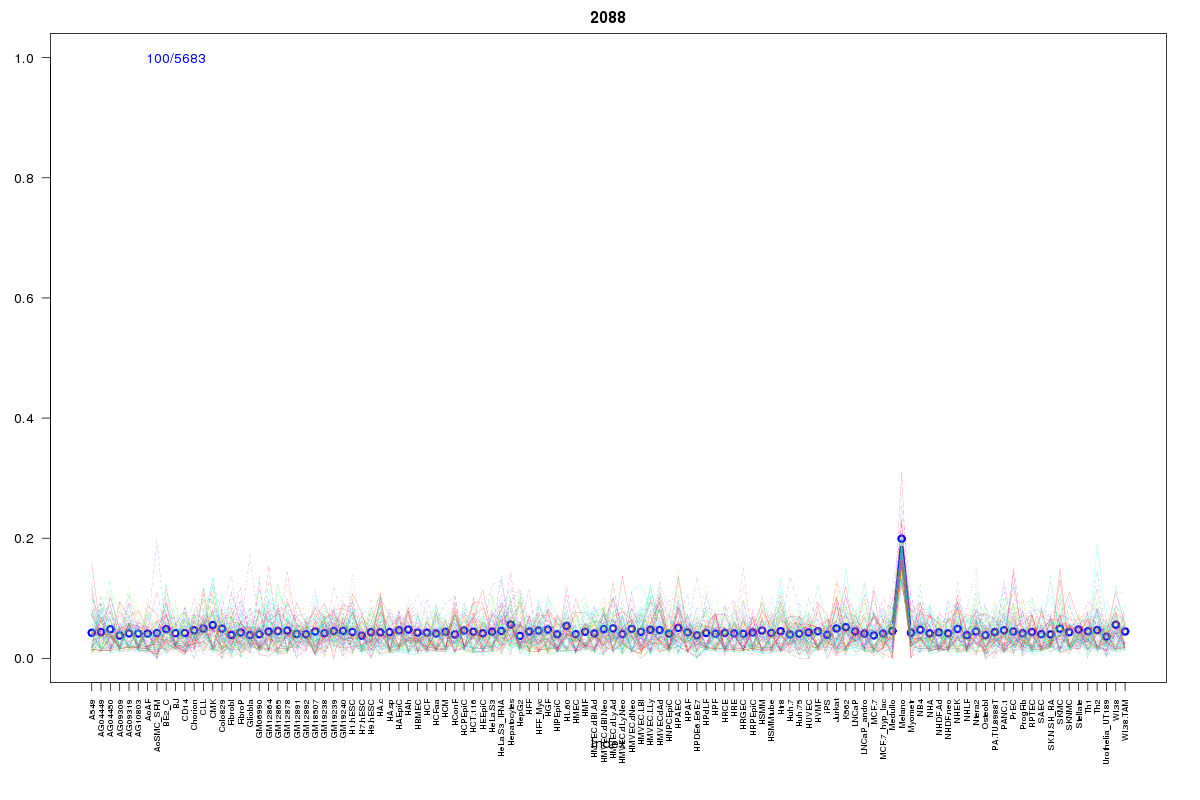 | 2088 | 1 |
Resources
BED file downloads
Connects to 31 DHS sitesTop 10 Correlated DHS Sites
p-values indiciate significant higher or lower correlation| Location | Cluster | P-value |
|---|---|---|
| chr1:1040340-1040490 | 430 | 0.008 |
| chr1:1077860-1078010 | 582 | 0.009 |
| chr1:1028385-1028535 | 1459 | 0.014 |
| chr1:1063205-1063355 | 1008 | 0.014 |
| chr1:1117825-1117975 | 772 | 0.023 |
| chr1:1092900-1093050 | 249 | 0.023 |
| chr1:1154985-1155135 | 1078 | 0.023 |
| chr1:1050905-1051055 | 1078 | 0.023 |
| chr1:1058005-1058155 | 2122 | 0.023 |
| chr1:1067465-1067615 | 2327 | 0.022 |
| chr1:1190100-1190250 | 1791 | 0.021 |
External Databases
UCSCEnsembl (ENSG00000207730)