SOM cluster: 249
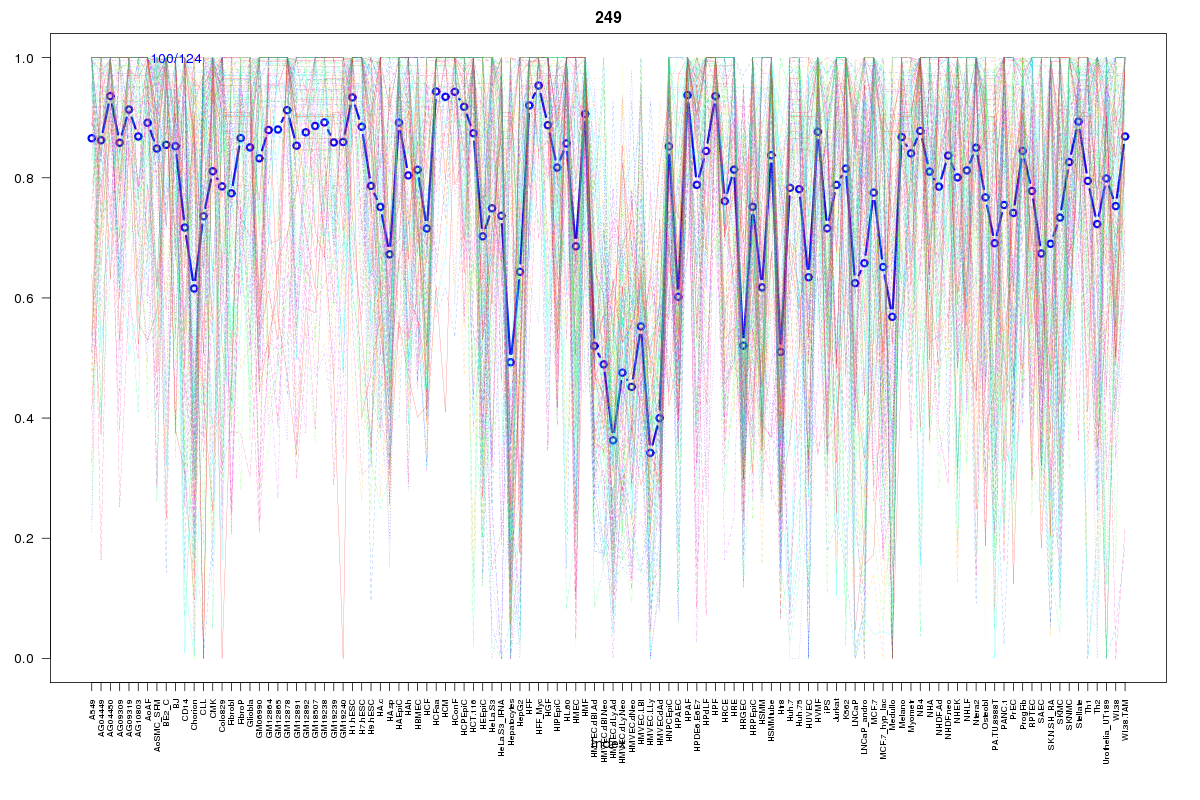
Cluster Hypersensitivity Profile

Genomic Location Trend
These plots show the distribution of the DHS sites surrounding the Transcript Start Site of the nearest gene.
Stats
Number of sites: 124Promoter: 37%
CpG-Island: 32%
Conserved: 64%
Enriched Motifs & Matches
Match Detail: [Jaspar]
|
| ||
|---|---|---|
| Sites: 62/100 | e-val: 1.3e-19 | ||
| Factor | e-val(match) | DB |
| SP1 | 0.00000000000067968 | JASPAR |
| Klf4 | 0.0000000085944 | JASPAR |
| INSM1 | 0.0011743 | JASPAR |
| Egr1 | 0.0017903 | JASPAR |
| ESR1 | 0.0029204 | JASPAR |
|
| ||
| Sites: 26/100 | e-val: 0.00000000048 | ||
| Factor | e-val(match) | DB |
| SP1 | 0.000054066 | JASPAR |
| EWSR1-FLI1 | 0.00045513 | JASPAR |
| SPIB | 0.0039955 | JASPAR |
| SPI1 | 0.0084591 | JASPAR |
| Myf | 0.012658 | JASPAR |
BED file downloads
Top 10 Example Regions
| Location | Gene Link | Dist. |
|---|---|---|
| chr16: 14379880-14380030 | MKL2 | 45.49 |
| chr19: 8943585-8943735 | MUC16 | 64.28 |
| chr19: 8943585-8943735 | ZNF558 | 64.28 |
| chr14: 24563260-24563410 | PCK2 | 65.38 |
| chr7: 90033140-90033290 | AC002064.5 | 66.17 |
| chr7: 90033140-90033290 | CDK14 | 66.17 |
| chr7: 90033140-90033290 | C7orf63 | 66.17 |
| chr11: 47600180-47600330 | NDUFS3 | 68.73 |
| chr11: 47600180-47600330 | PTPMT1 | 68.73 |
| chr11: 47600180-47600330 | FAM180B | 68.73 |