Gene: ATP1A1OS
chr1: 116934868-116961244Expression Profile
(log scale)
Graphical Connections
Distribution of linked clusters:
You may find it interesting if many of the connected DHS sites belong to the same cluster.| Cluster Profile | Cluster ID | Number of DHS sites in this cluster |
|---|---|---|
 | 2186 | 3 |
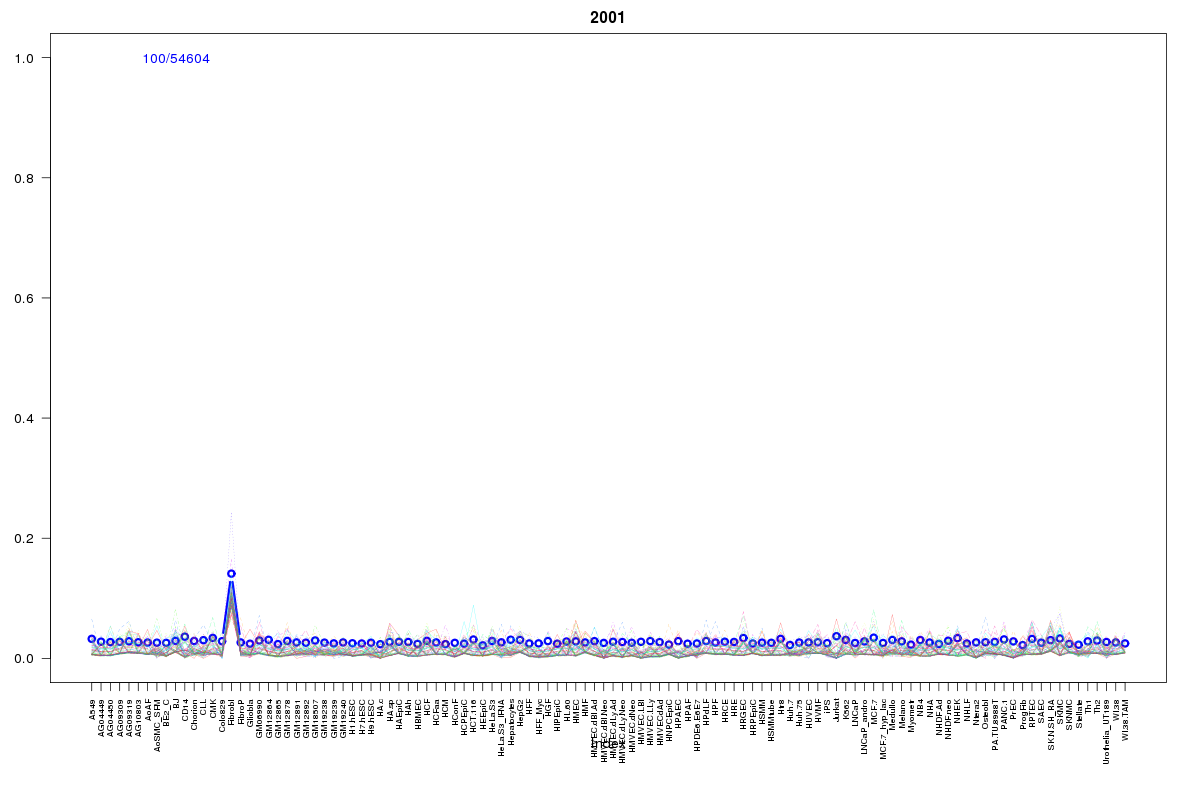 | 2001 | 2 |
 | 130 | 2 |
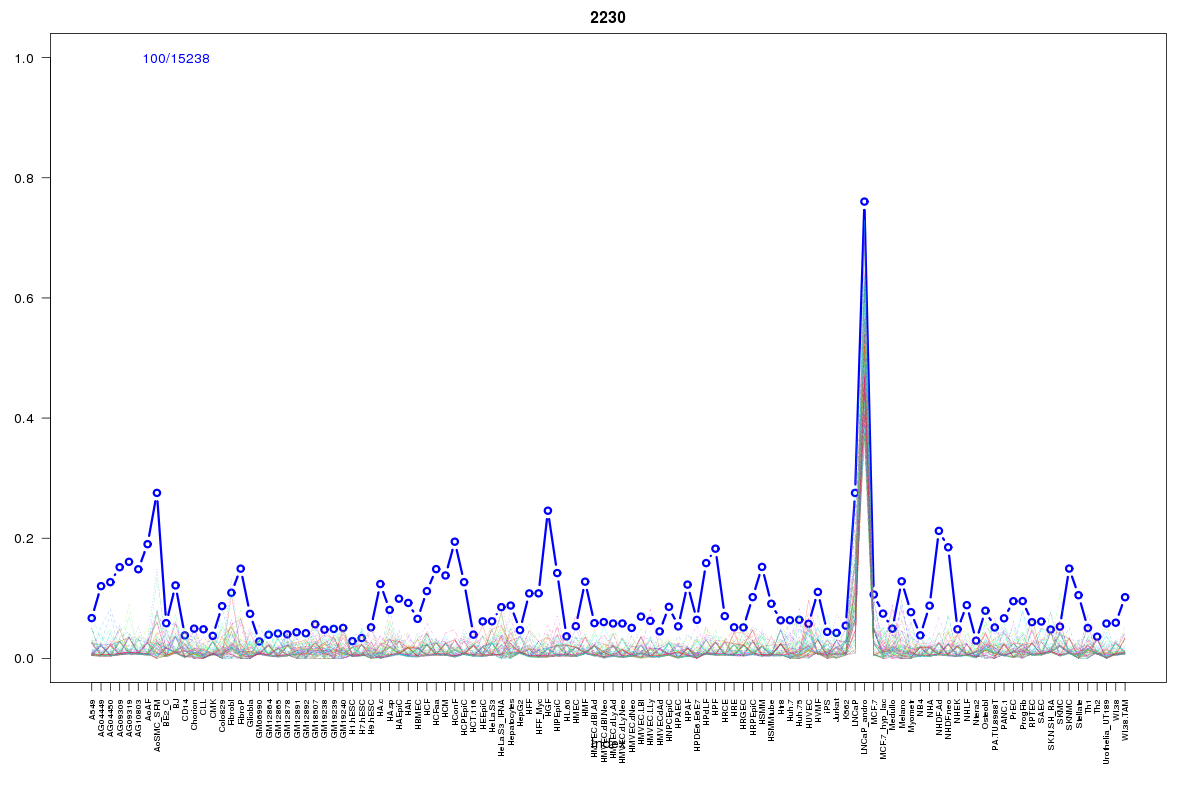 | 2230 | 2 |
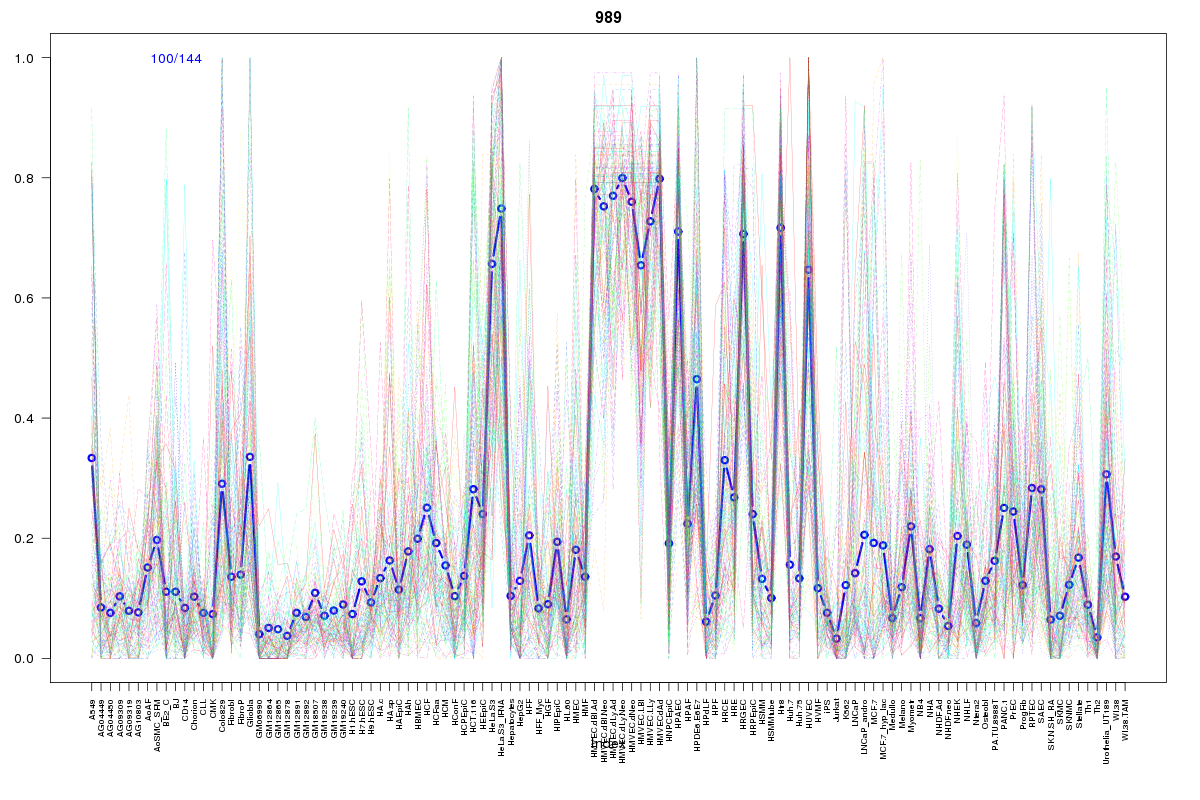 | 989 | 1 |
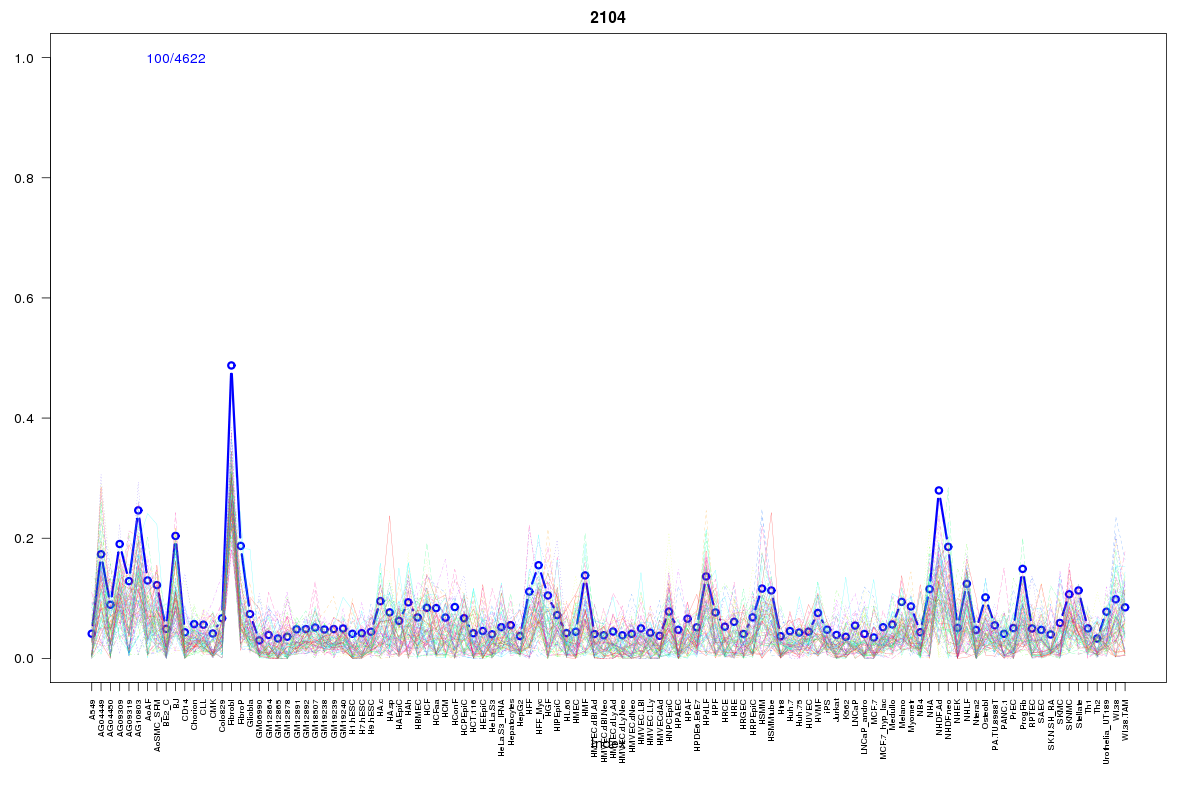 | 2104 | 1 |
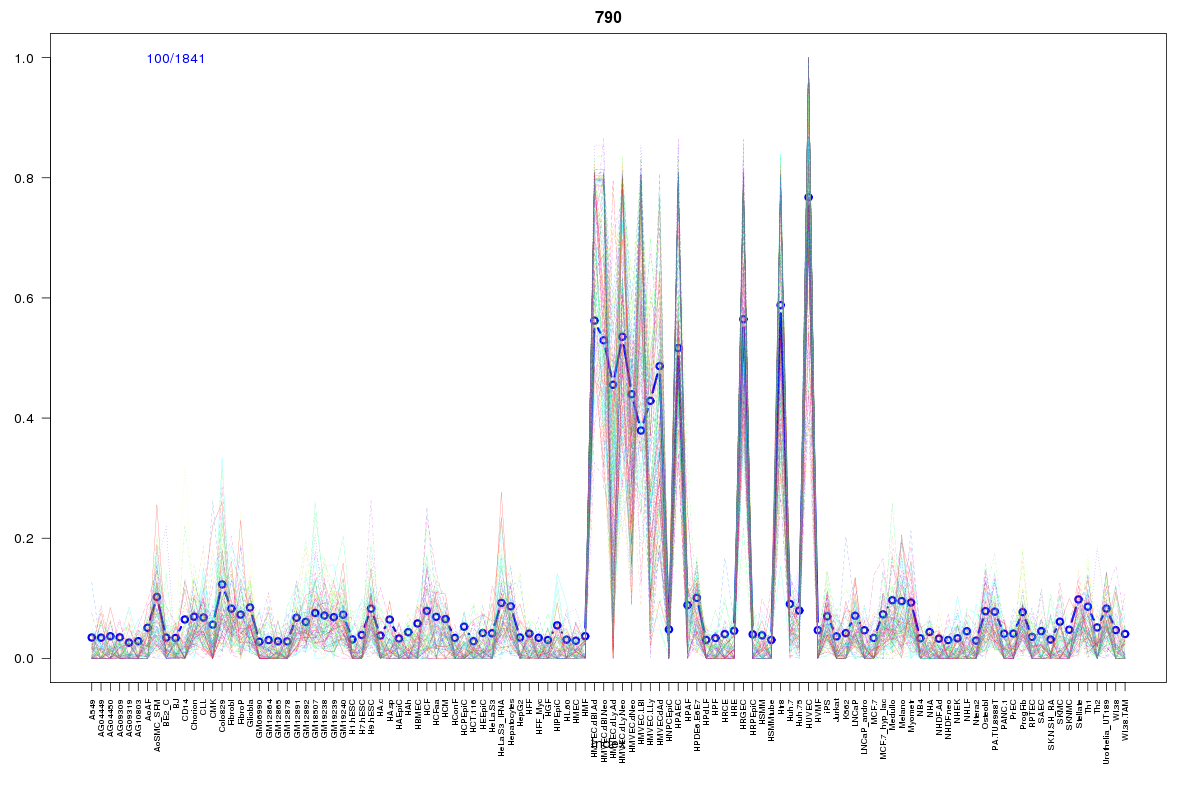 | 790 | 1 |
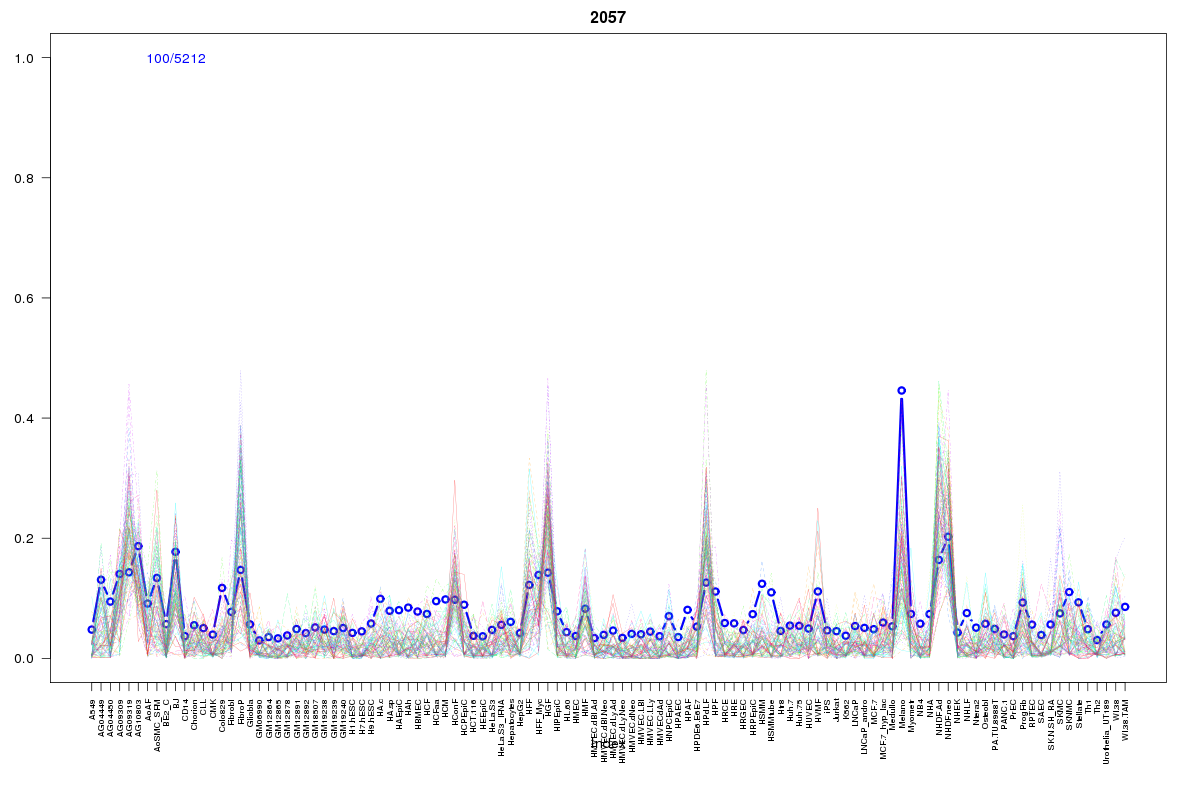 | 2057 | 1 |
 | 469 | 1 |
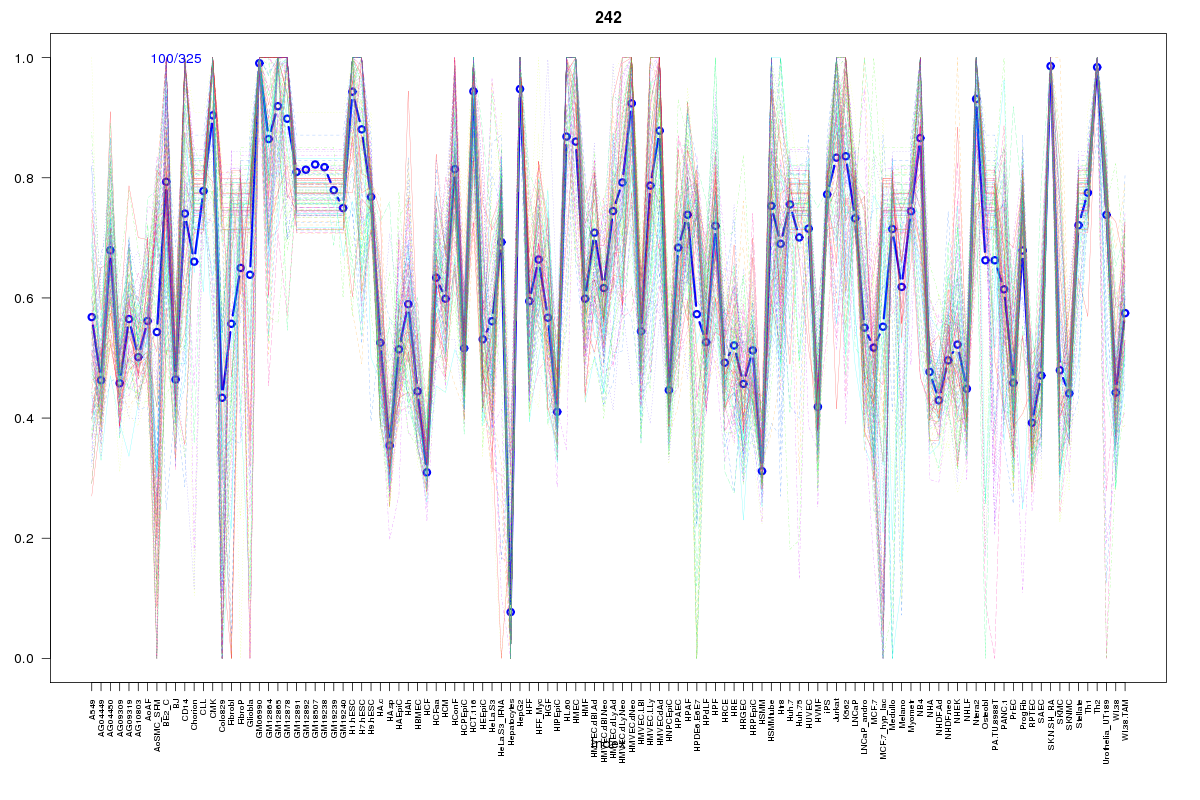 | 242 | 1 |
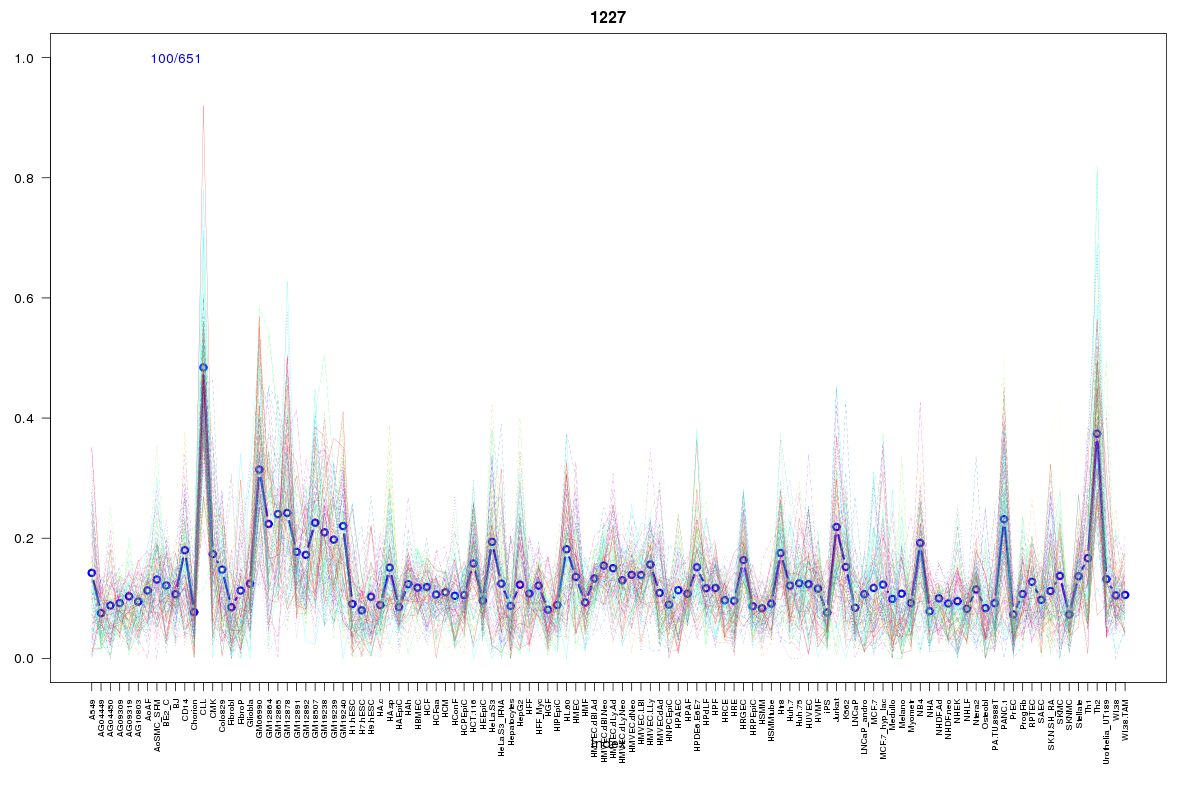 | 1227 | 1 |
 | 813 | 1 |
 | 1625 | 1 |
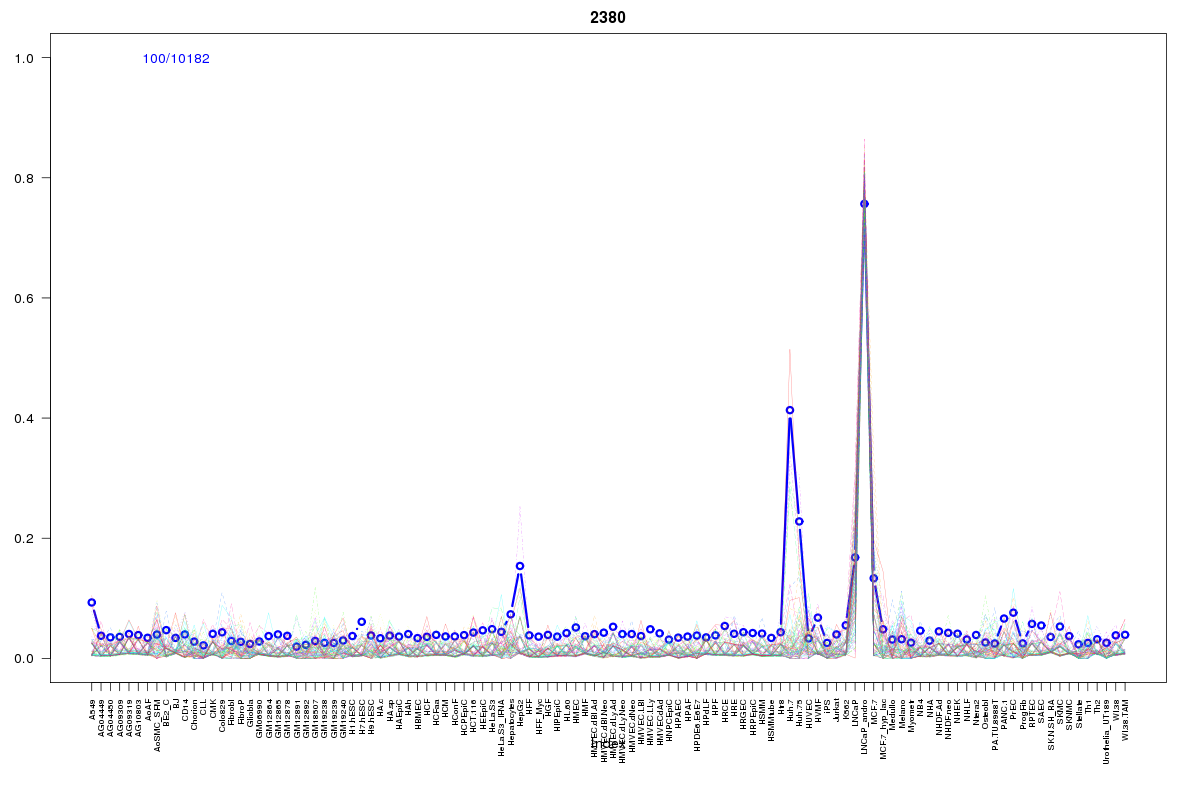 | 2380 | 1 |
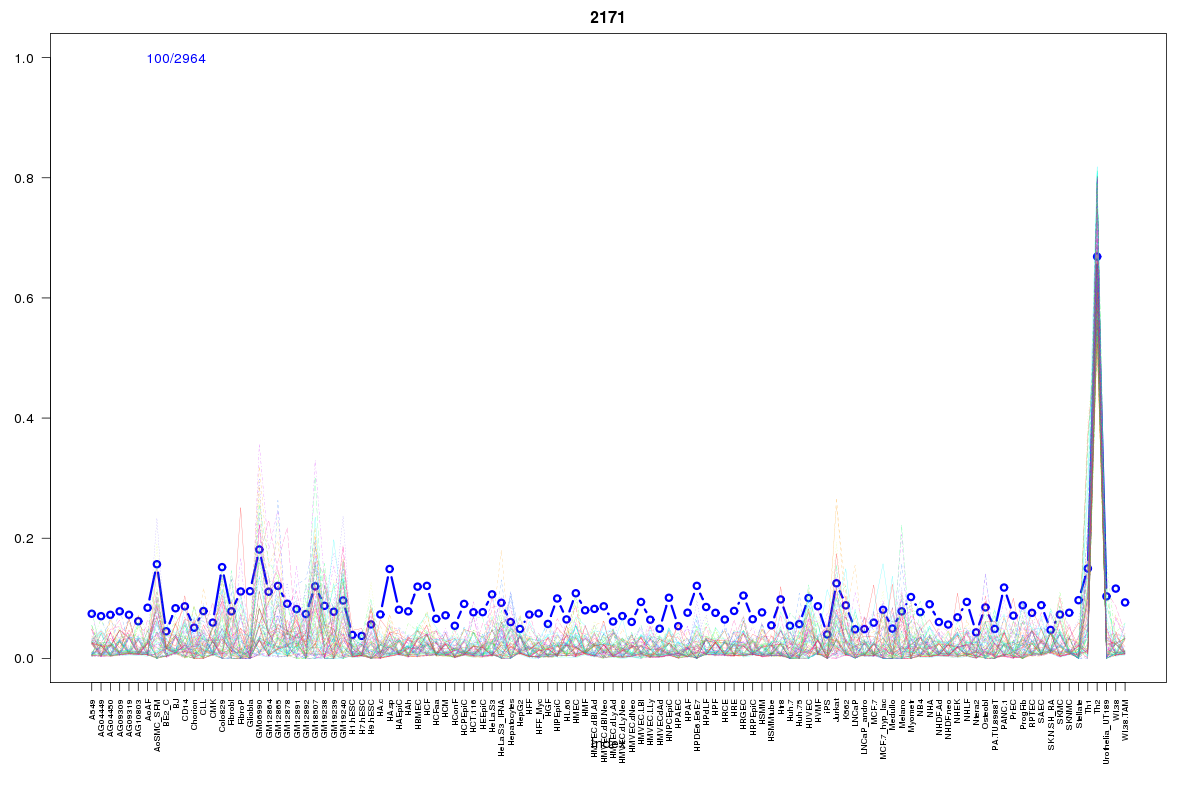 | 2171 | 1 |
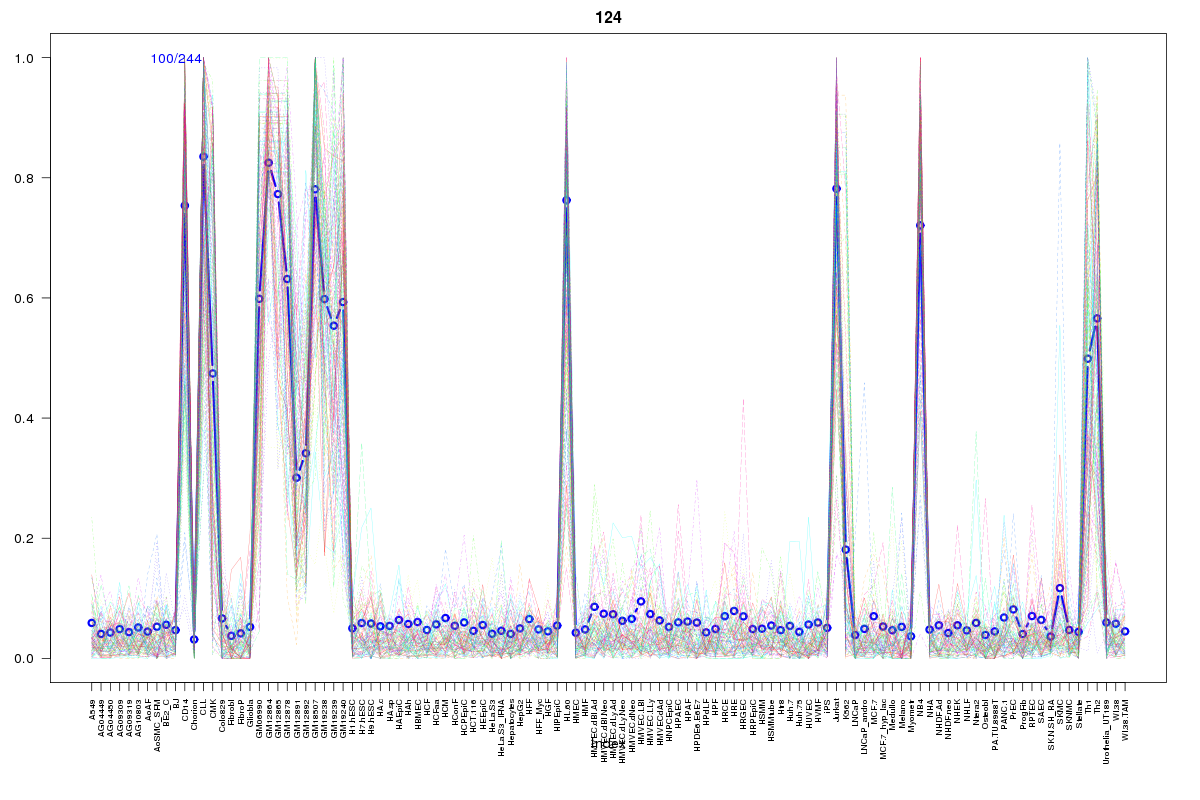 | 124 | 1 |
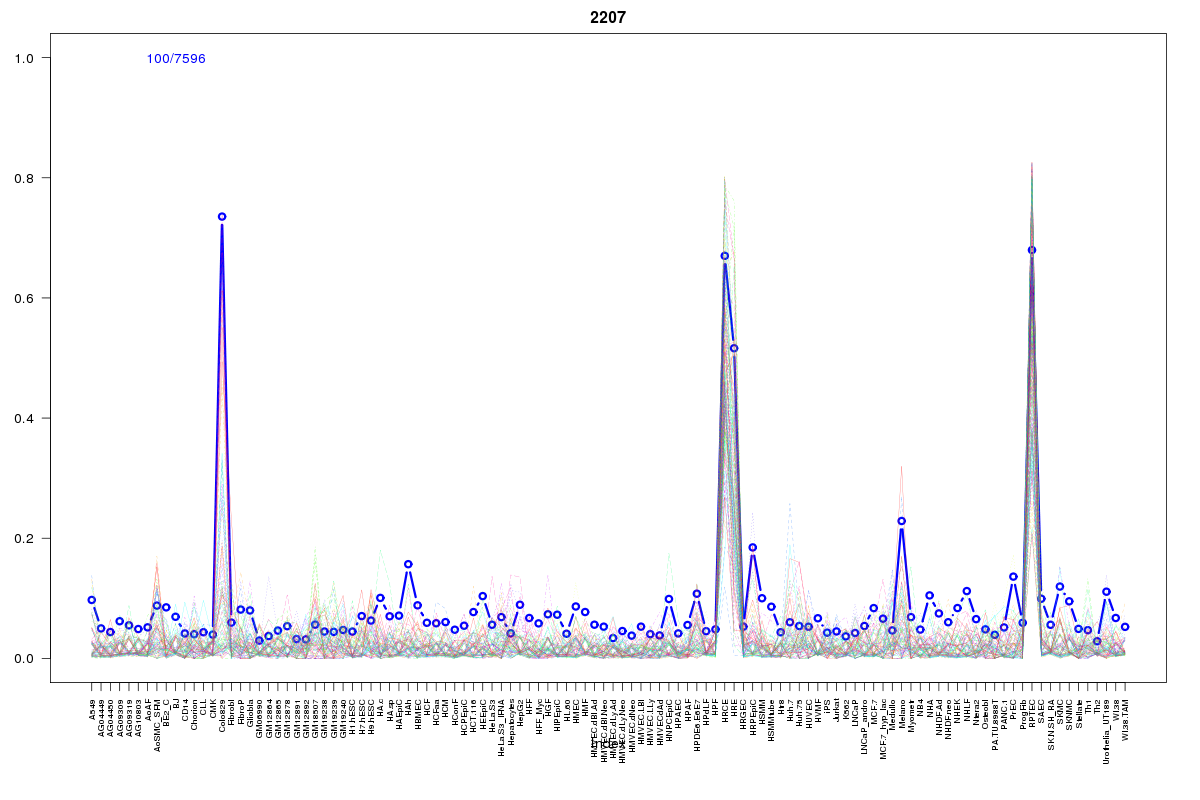 | 2207 | 1 |
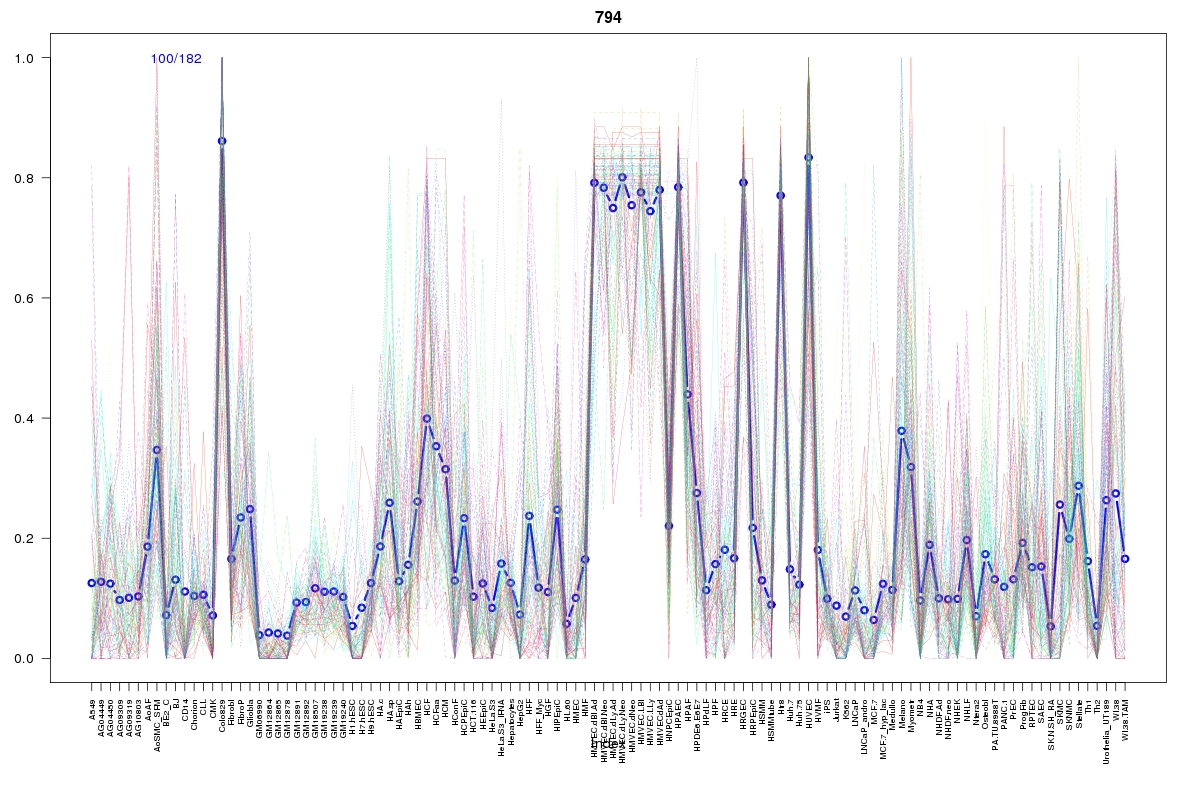 | 794 | 1 |
Resources
BED file downloads
Connects to 23 DHS sitesTop 10 Correlated DHS Sites
p-values indiciate significant higher or lower correlation| Location | Cluster | P-value |
|---|---|---|
| chr1:117057840-117057990 | 130 | 0 |
| chr1:117057580-117057730 | 124 | 0.002 |
| chr1:117047480-117047630 | 2171 | 0.002 |
| chr1:117047160-117047310 | 130 | 0.002 |
| chr1:117023985-117024135 | 2186 | 0.002 |
| chr1:116961460-116961610 | 1227 | 0.002 |
| chr1:117019100-117019250 | 813 | 0.003 |
| chr1:116961180-116961330 | 242 | 0.003 |
| chr1:116873040-116873190 | 2207 | 0.003 |
| chr1:116869180-116869330 | 2230 | 0.012 |
| chr1:116994740-116994890 | 2186 | 0.012 |
External Databases
UCSCEnsembl (ENSG00000203865)