Gene: PBRM1
chr3: 52579367-52713730Expression Profile
(log scale)
Graphical Connections
Distribution of linked clusters:
You may find it interesting if many of the connected DHS sites belong to the same cluster.| Cluster Profile | Cluster ID | Number of DHS sites in this cluster |
|---|---|---|
 | 2110 | 4 |
 | 2114 | 3 |
 | 2279 | 1 |
 | 1078 | 1 |
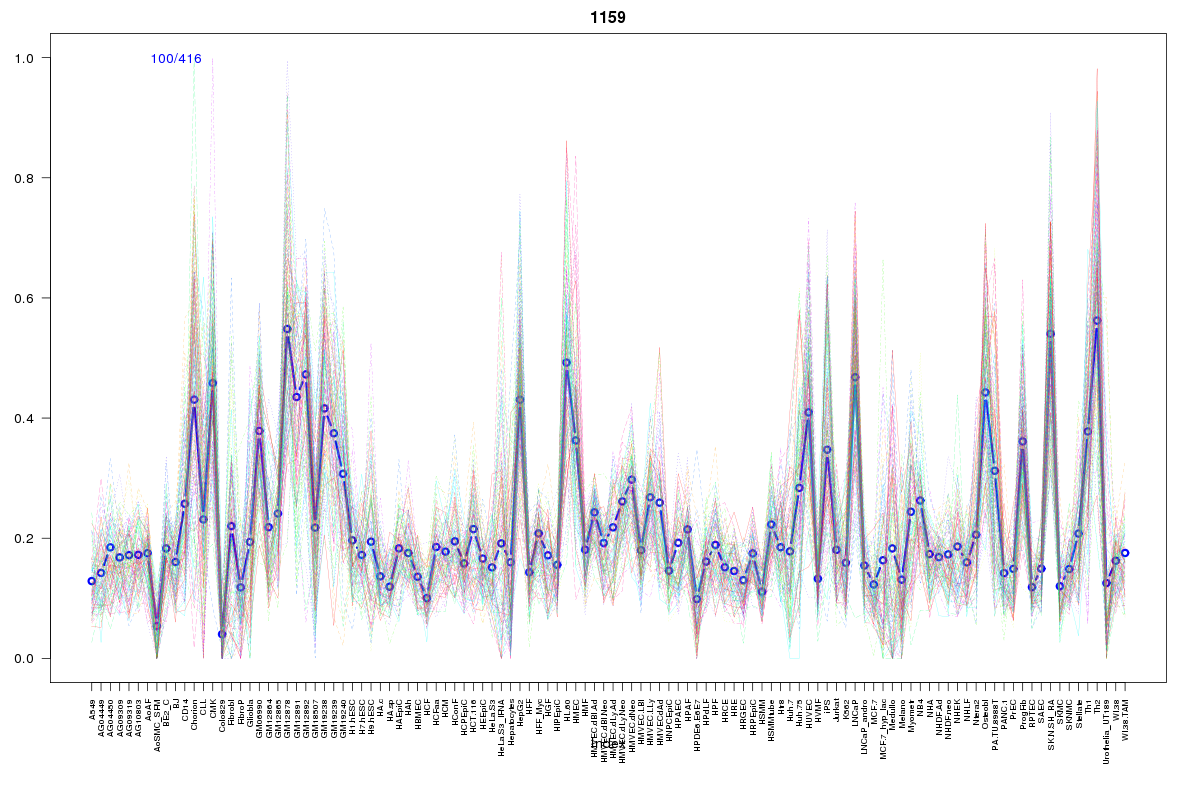 | 1159 | 1 |
 | 2186 | 1 |
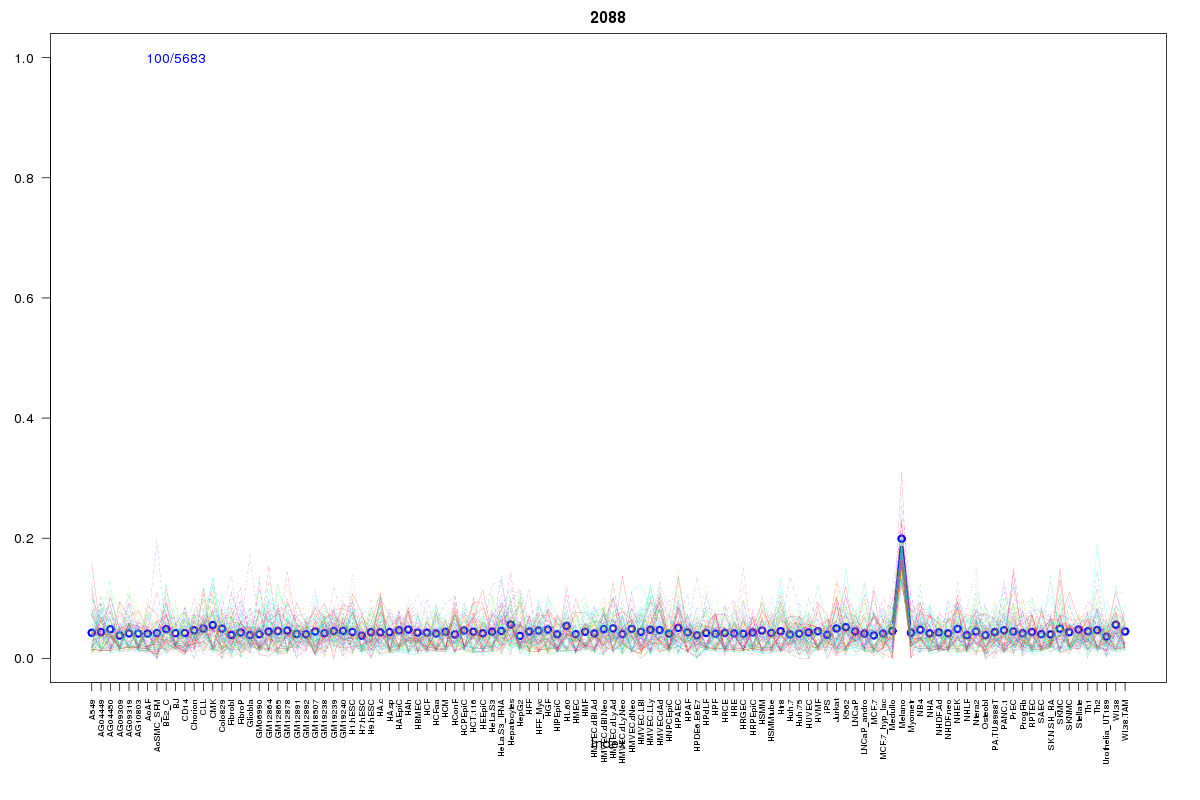 | 2088 | 1 |
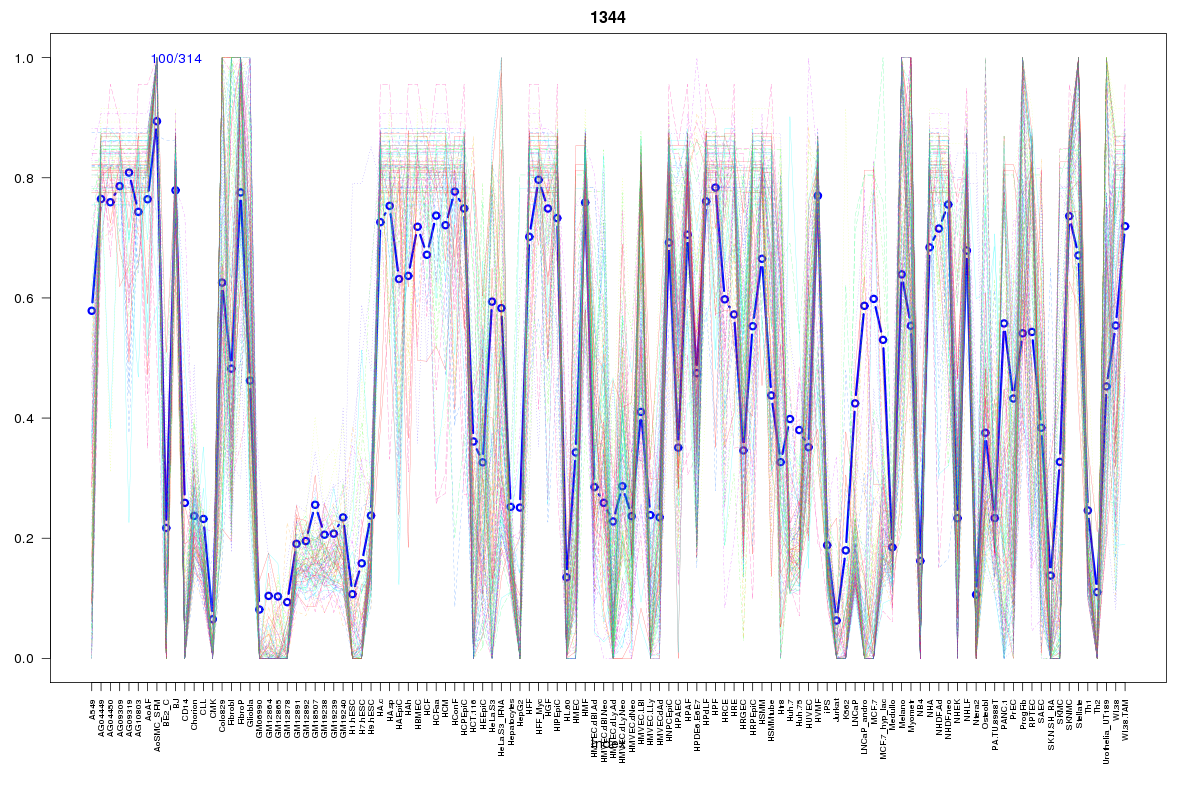 | 1344 | 1 |
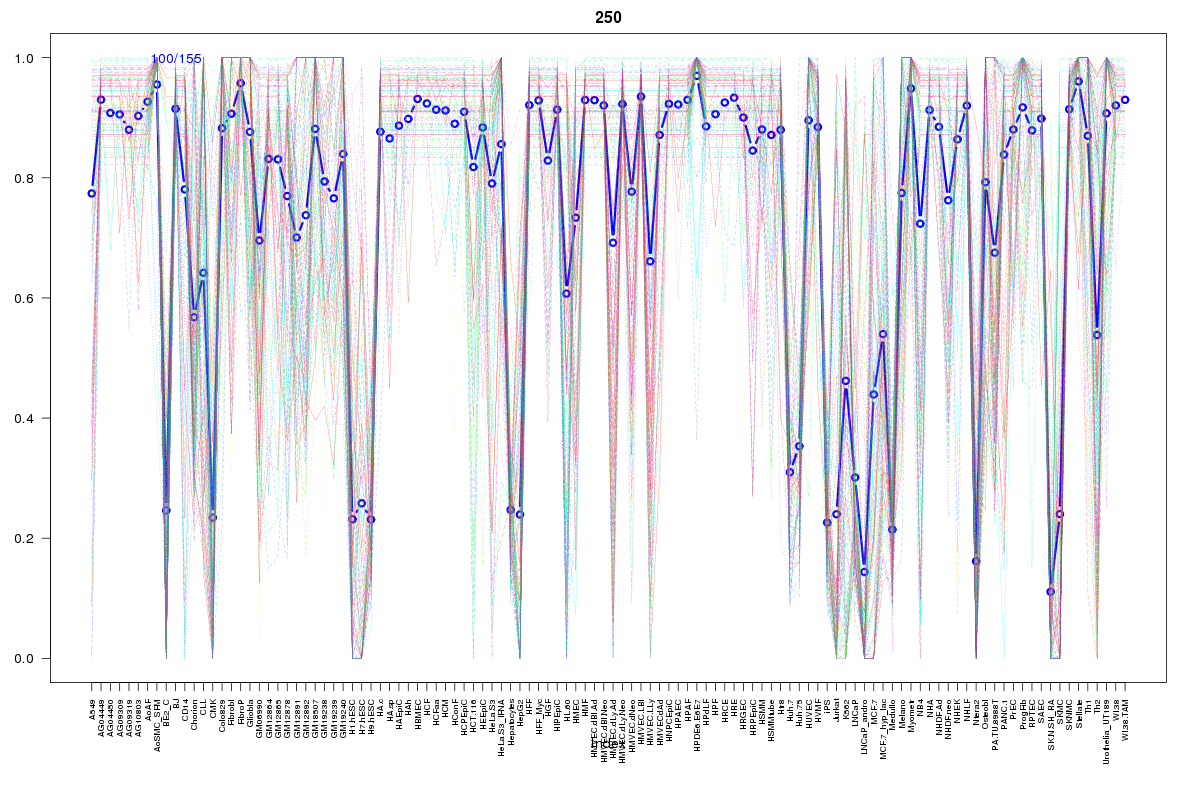 | 250 | 1 |
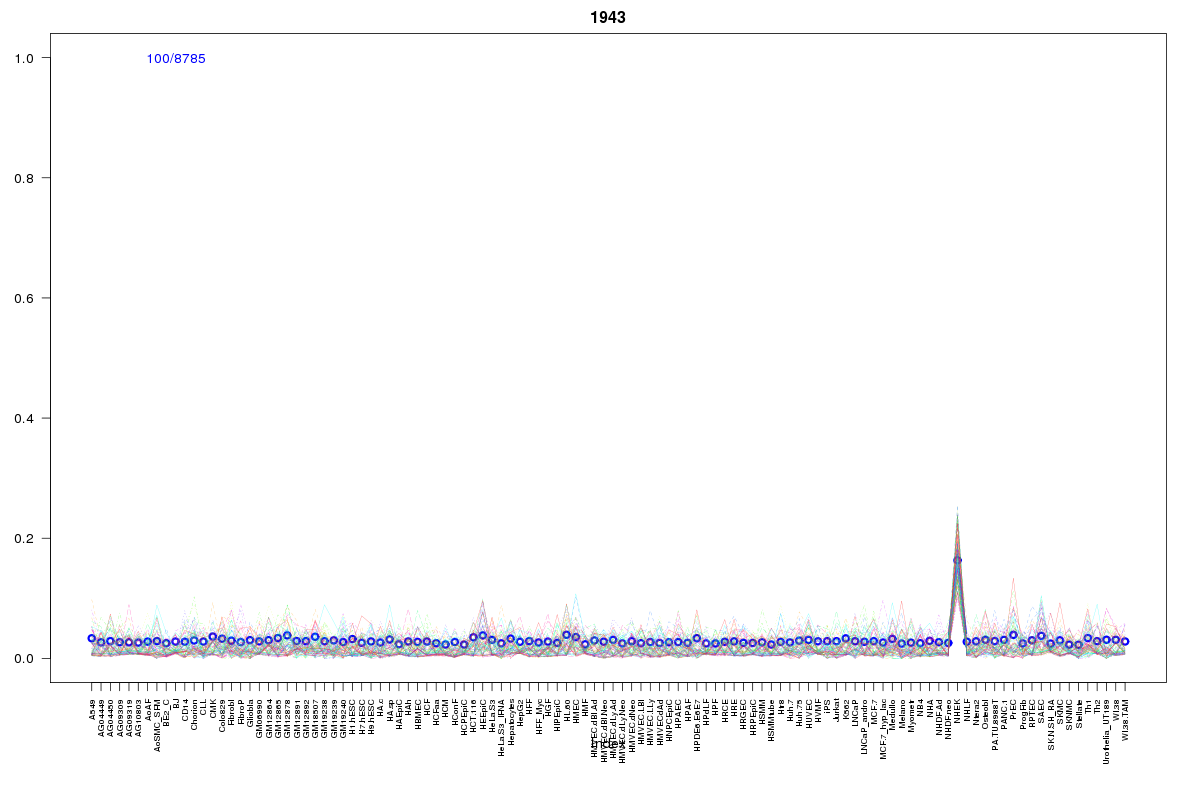 | 1943 | 1 |
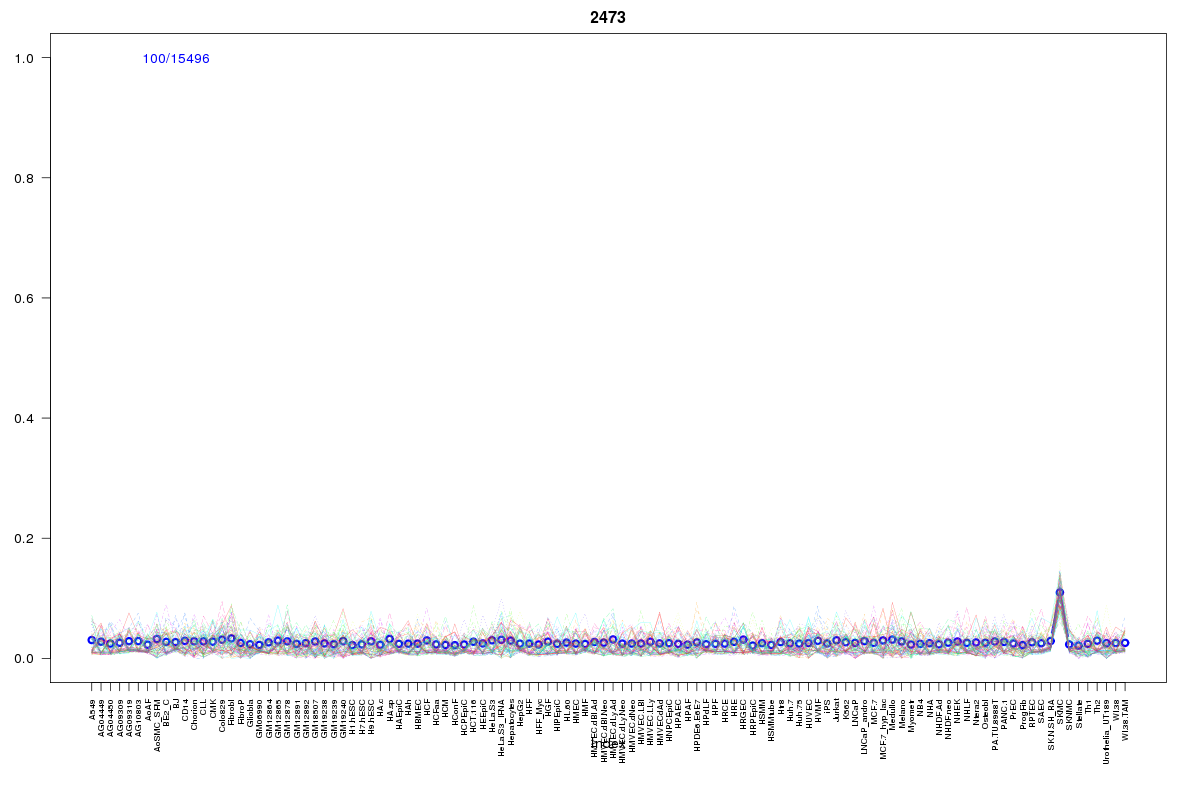 | 2473 | 1 |
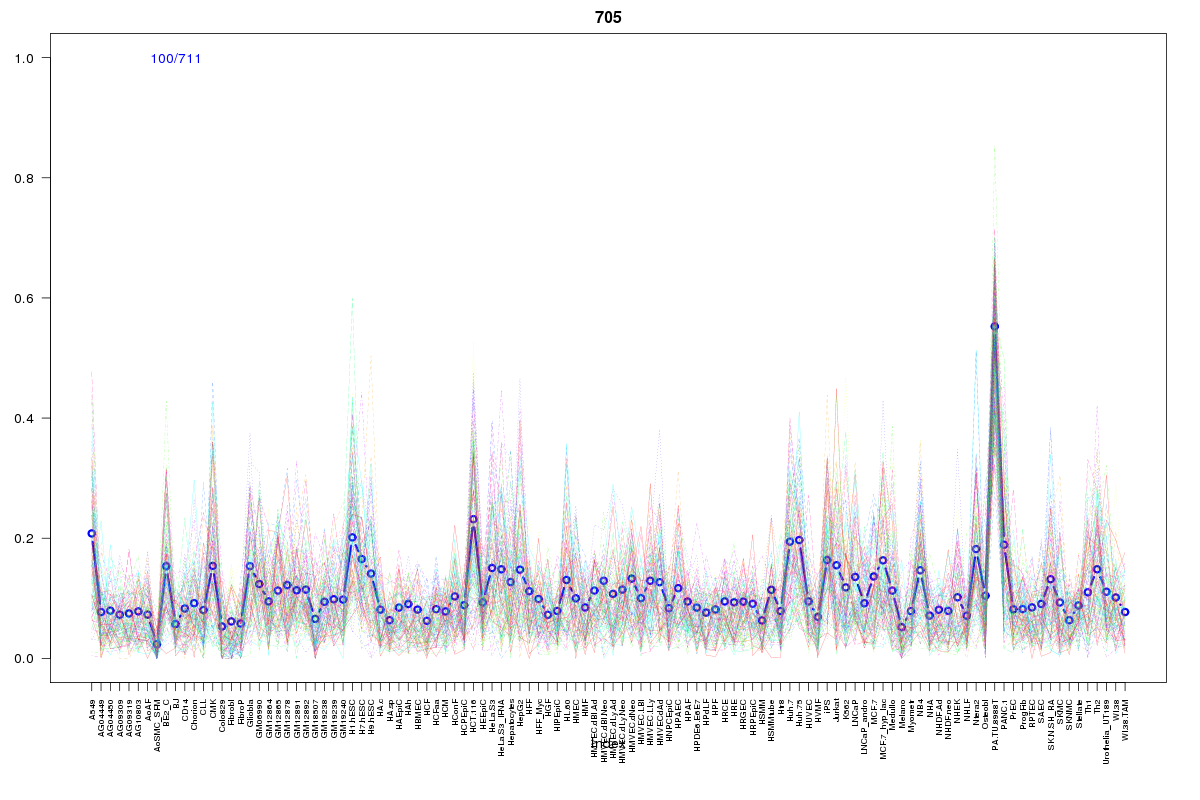 | 705 | 1 |
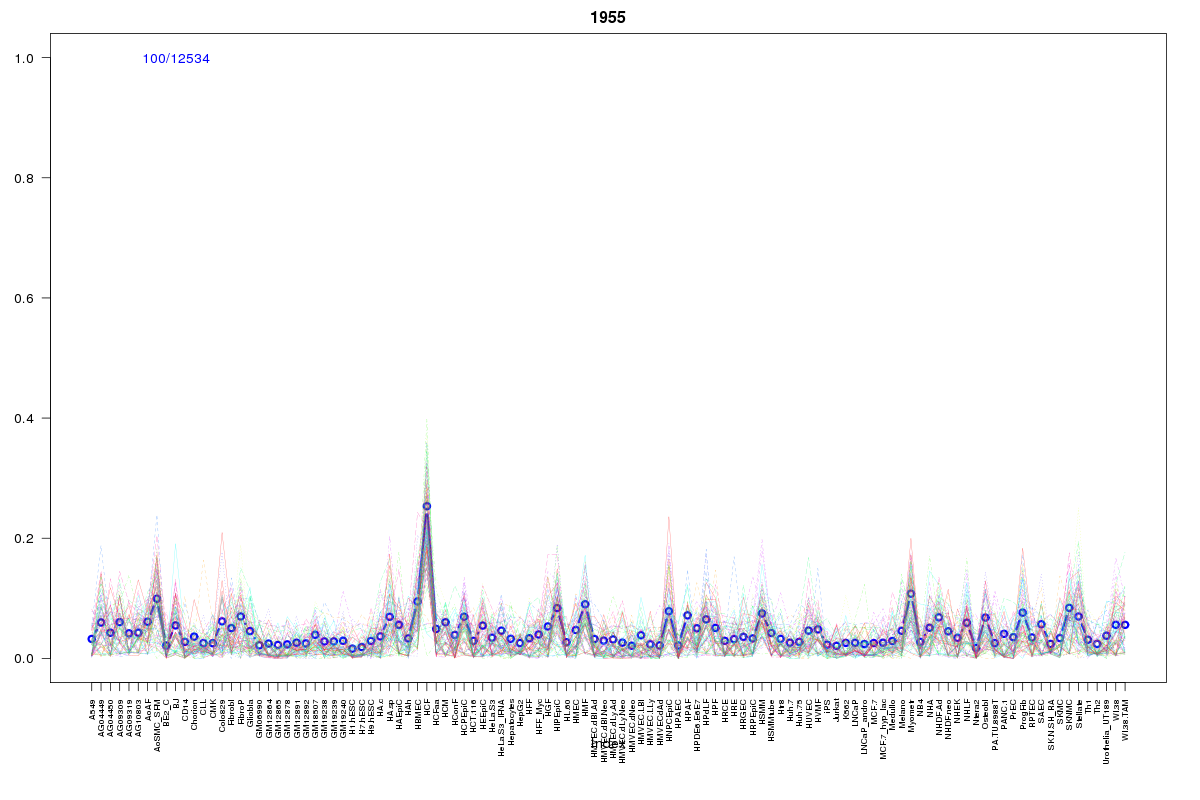 | 1955 | 1 |
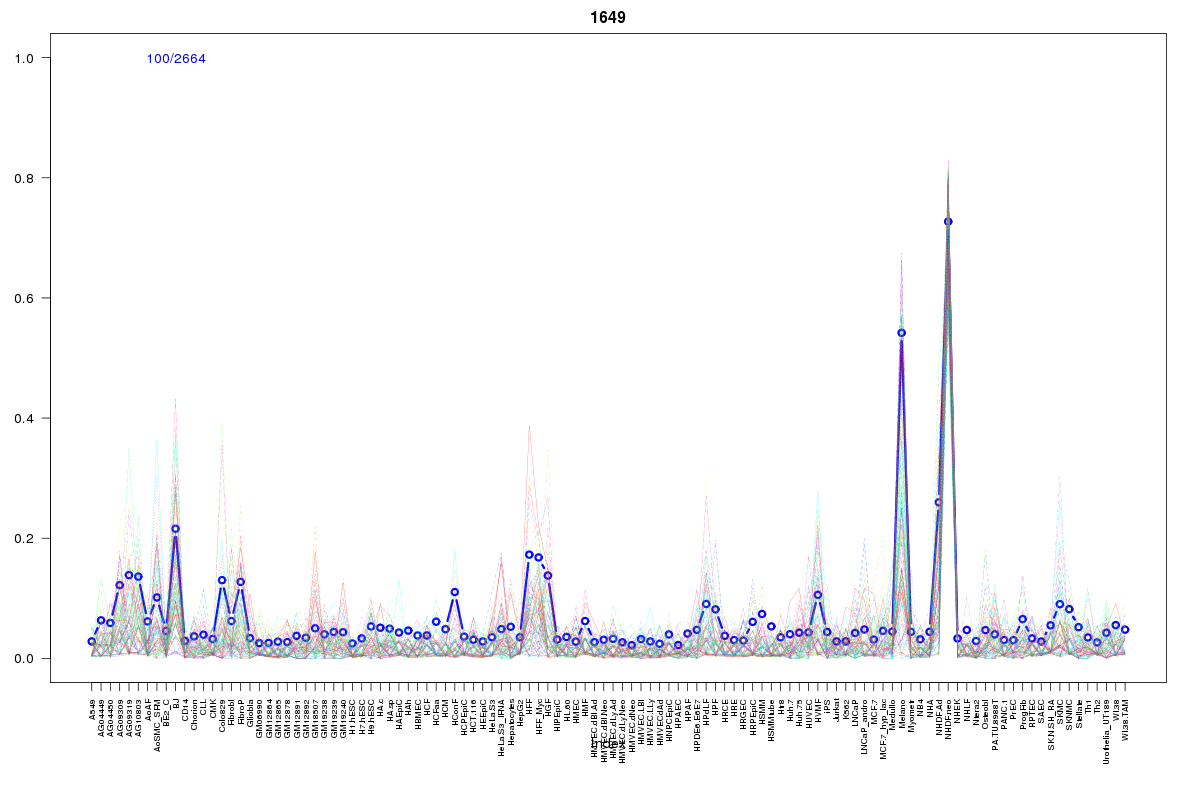 | 1649 | 1 |
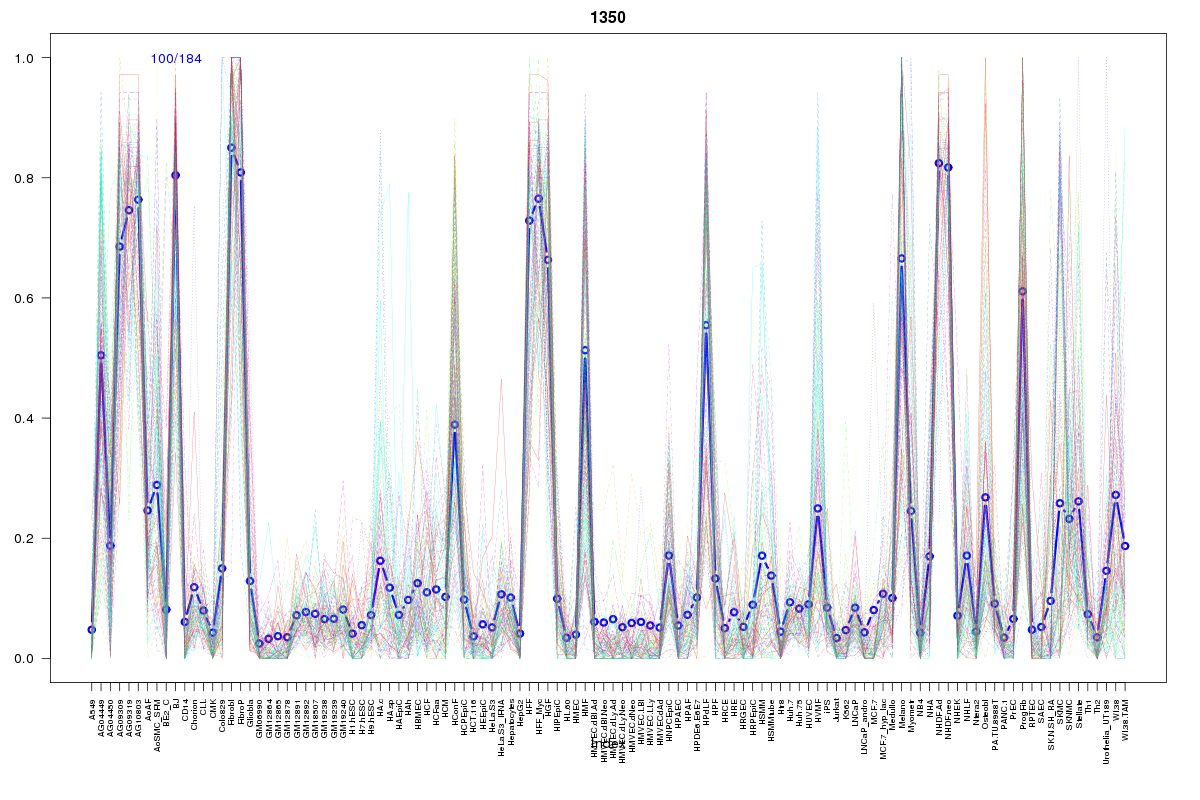 | 1350 | 1 |
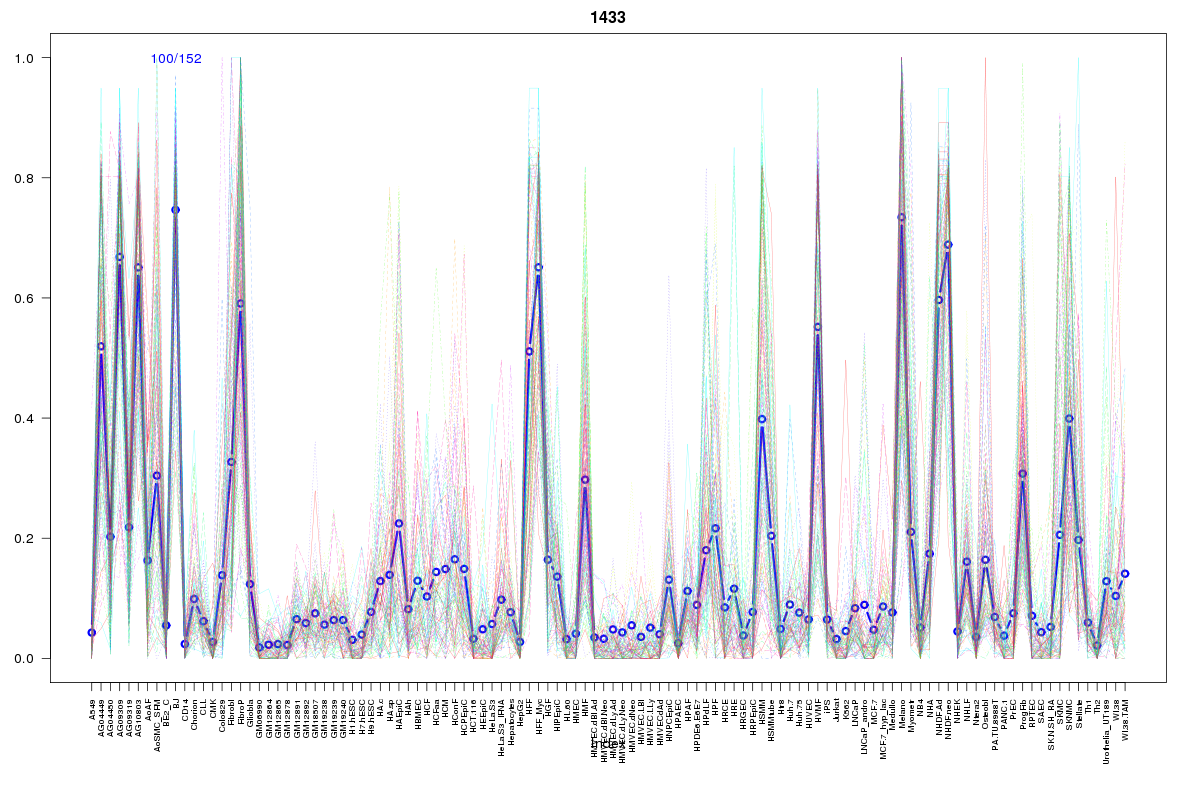 | 1433 | 1 |
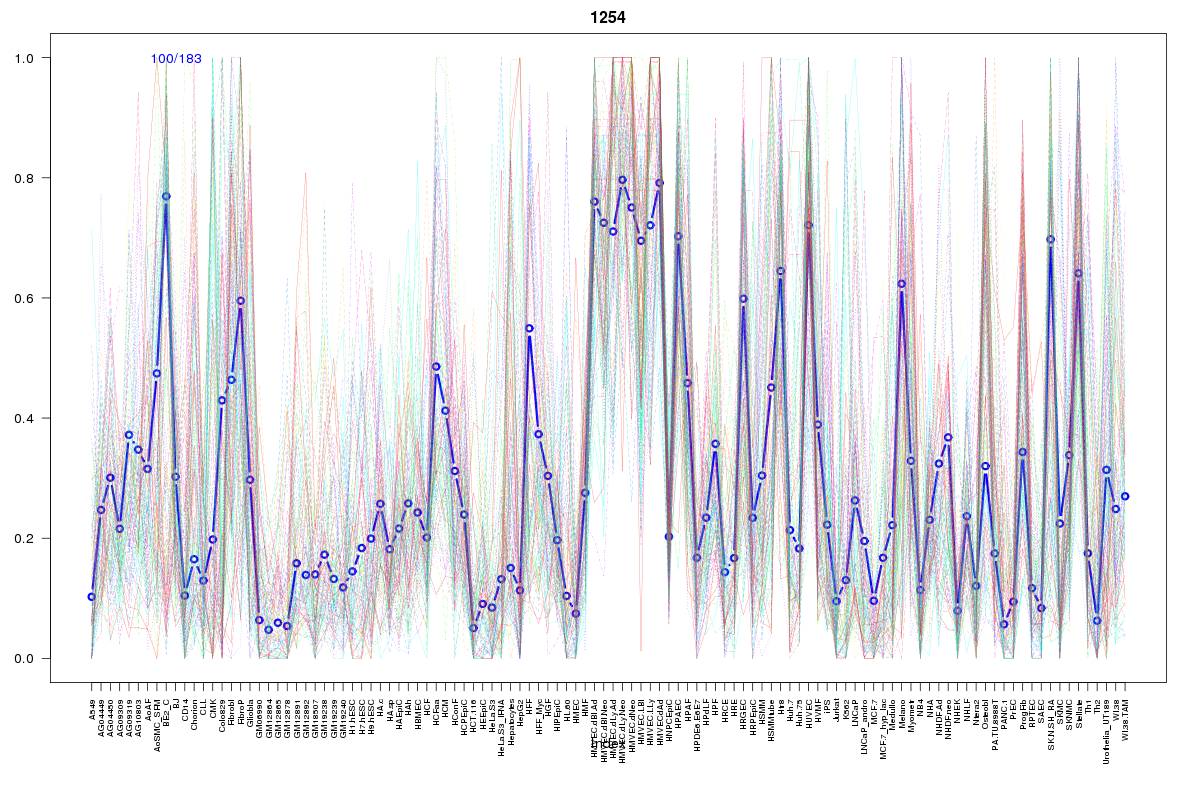 | 1254 | 1 |
Resources
BED file downloads
Connects to 22 DHS sitesTop 10 Correlated DHS Sites
p-values indiciate significant higher or lower correlation| Location | Cluster | P-value |
|---|---|---|
| chr3:52722000-52722150 | 2114 | 0.003 |
| chr3:52752560-52752710 | 2114 | 0.008 |
| chr3:52745965-52746115 | 2110 | 0.008 |
| chr3:52654180-52654330 | 2110 | 0.01 |
| chr3:52569880-52570030 | 2114 | 0.016 |
| chr3:52817365-52817515 | 1955 | 0.016 |
| chr3:52758140-52758290 | 2110 | 0.016 |
| chr3:52765565-52765715 | 2473 | 0.016 |
| chr3:52762920-52763070 | 2110 | 0.019 |
| chr3:52574220-52574370 | 2186 | 0.022 |
| chr3:52551445-52551595 | 1078 | 0.022 |
External Databases
UCSCEnsembl (ENSG00000163939)