SOM cluster: 705
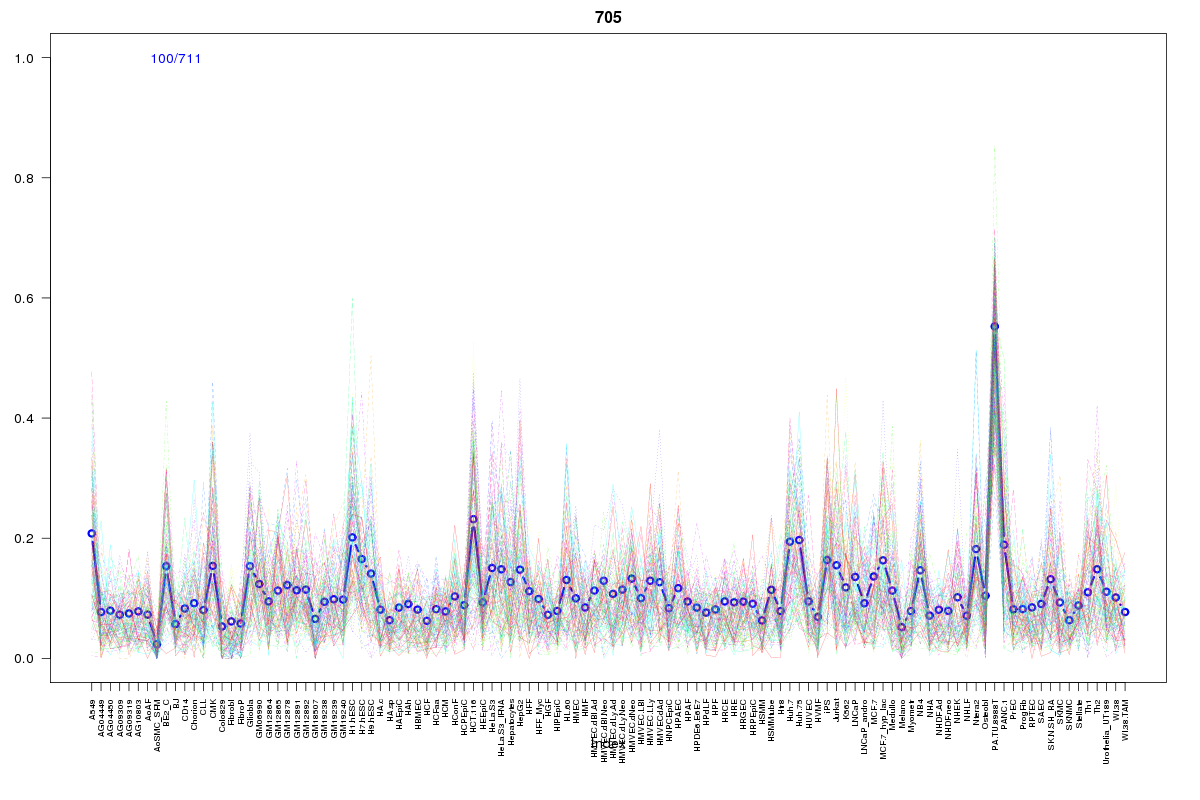
Cluster Hypersensitivity Profile

Genomic Location Trend
These plots show the distribution of the DHS sites surrounding the Transcript Start Site of the nearest gene.
Stats
Number of sites: 711Promoter: 10%
CpG-Island: 2%
Conserved: 30%
Enriched Motifs & Matches
Match Detail: [Jaspar]
|
| ||
|---|---|---|
| Sites: 88/100 | e-val: 2e-21 | ||
| Factor | e-val(match) | DB |
| Pax4 | 0.000046853 | JASPAR |
| INSM1 | 0.000068454 | JASPAR |
| PLAG1 | 0.00010048 | JASPAR |
| SP1 | 0.00042617 | JASPAR |
| RREB1 | 0.00056934 | JASPAR |
|
| ||
| Sites: 24/100 | e-val: 0.000012 | ||
| Factor | e-val(match) | DB |
| SP1 | 0.00000067301 | JASPAR |
| PLAG1 | 0.0015713 | JASPAR |
| MZF1_5-13 | 0.0028814 | JASPAR |
| Zfp423 | 0.00478 | JASPAR |
| CTCF | 0.005427 | JASPAR |
|
| ||
| Sites: 14/100 | e-val: 0.33 | ||
| Factor | e-val(match) | DB |
| Stat3 | 0.011047 | JASPAR |
| NFIC | 0.017529 | JASPAR |
| E2F1 | 0.01993 | JASPAR |
| EBF1 | 0.029187 | JASPAR |
| NFE2L2 | 0.047522 | JASPAR |
BED file downloads
Top 10 Example Regions
| Location | Gene Link | Dist. |
|---|---|---|
| chr9: 127534640-127534790 | MIR181A2 | 41.02 |
| chr9: 127534640-127534790 | RPL35 | 41.02 |
| chr6: 36804305-36804455 | PPIL1 | 42.55 |
| chr11: 75087400-75087550 | SNORD15A | 47.76 |
| chr11: 75087400-75087550 | RPS3 | 47.76 |
| chr16: 87523185-87523335 | ZCCHC14 | 50.9 |
| chr17: 74028525-74028675 | GALR2 | 51.2 |
| chr17: 74028525-74028675 | EXOC7 | 51.2 |
| chr8: 143837425-143837575 | SLURP1 | 51.26 |
| chr11: 69923965-69924115 | RP11-626H12.2 | 53.07 |