SOM cluster: 1254
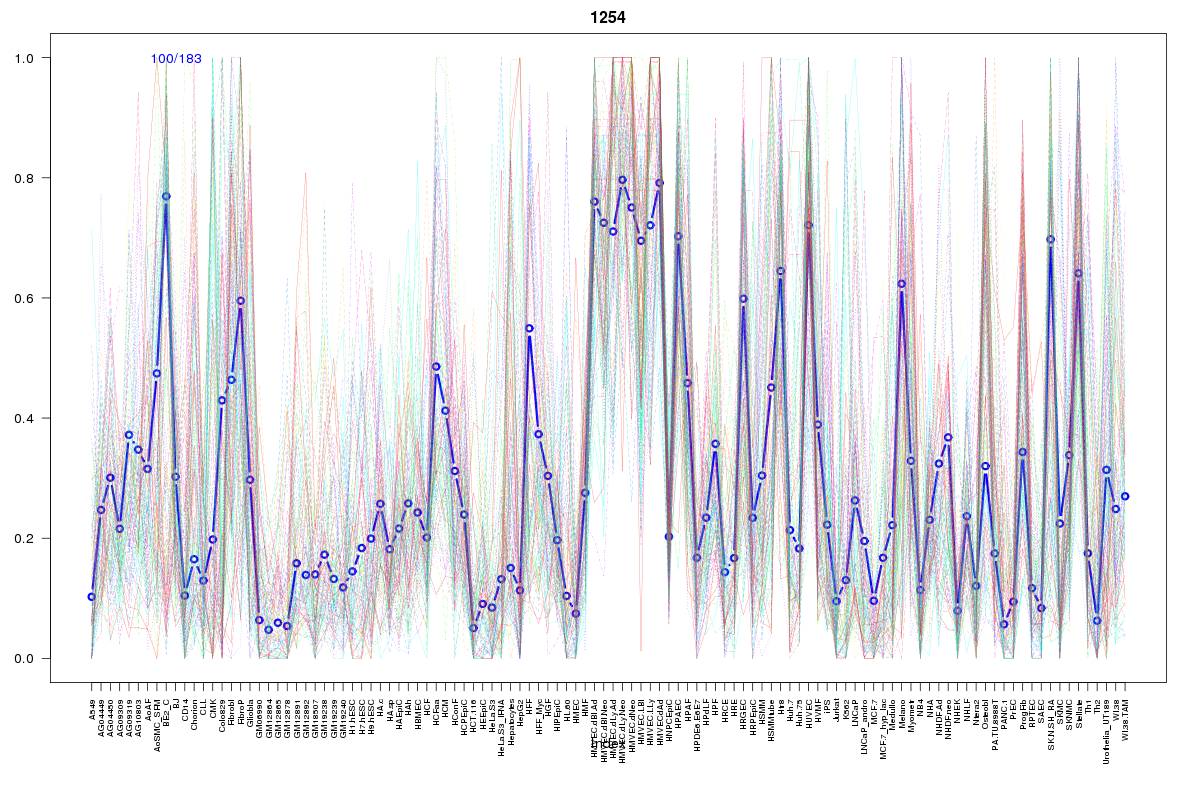
Cluster Hypersensitivity Profile

Genomic Location Trend
These plots show the distribution of the DHS sites surrounding the Transcript Start Site of the nearest gene.
Stats
Number of sites: 183Promoter: 9%
CpG-Island: 13%
Conserved: 67%
Enriched Motifs & Matches
Match Detail: [Jaspar]
|
| ||
|---|---|---|
| Sites: 72/100 | e-val: 1.2e-17 | ||
| Factor | e-val(match) | DB |
| SP1 | 0.00014565 | JASPAR |
| Myf | 0.0040647 | JASPAR |
| TFAP2A | 0.0060341 | JASPAR |
| Klf4 | 0.010981 | JASPAR |
| PLAG1 | 0.020791 | JASPAR |
|
| ||
| Sites: 46/100 | e-val: 0.000000014 | ||
| Factor | e-val(match) | DB |
| FEV | 0.00000000099737 | JASPAR |
| Stat3 | 0.0000000010605 | JASPAR |
| SPI1 | 0.000000084862 | JASPAR |
| ELF5 | 0.0000077456 | JASPAR |
| ELK4 | 0.000016399 | JASPAR |
|
| ||
| Sites: 25/100 | e-val: 0.0079 | ||
| Factor | e-val(match) | DB |
| SP1 | 0.0032079 | JASPAR |
| RREB1 | 0.023495 | JASPAR |
| Klf4 | 0.026805 | JASPAR |
| TFAP2A | 0.034375 | JASPAR |
| ESR1 | 0.041643 | JASPAR |
BED file downloads
Top 10 Example Regions
| Location | Gene Link | Dist. |
|---|---|---|
| chr9: 139519840-139519990 | FAM69B | 46.11 |
| chr17: 58212260-58212410 | CA4 | 51.49 |
| chr6: 16337505-16337655 | GMPR | 59.36 |
| chr3: 124491120-124491270 | UMPS | 59.84 |
| chr3: 124491120-124491270 | KALRN | 59.84 |
| chr19: 10513220-10513370 | ZGLP1 | 62.05 |
| chr19: 10513220-10513370 | CDC37 | 62.05 |
| chr19: 3670840-3670990 | PIP5K1C | 62.77 |
| chr19: 3670840-3670990 | TBXA2R | 62.77 |
| chr19: 3670840-3670990 | TJP3 | 62.77 |