SOM cluster: 1649
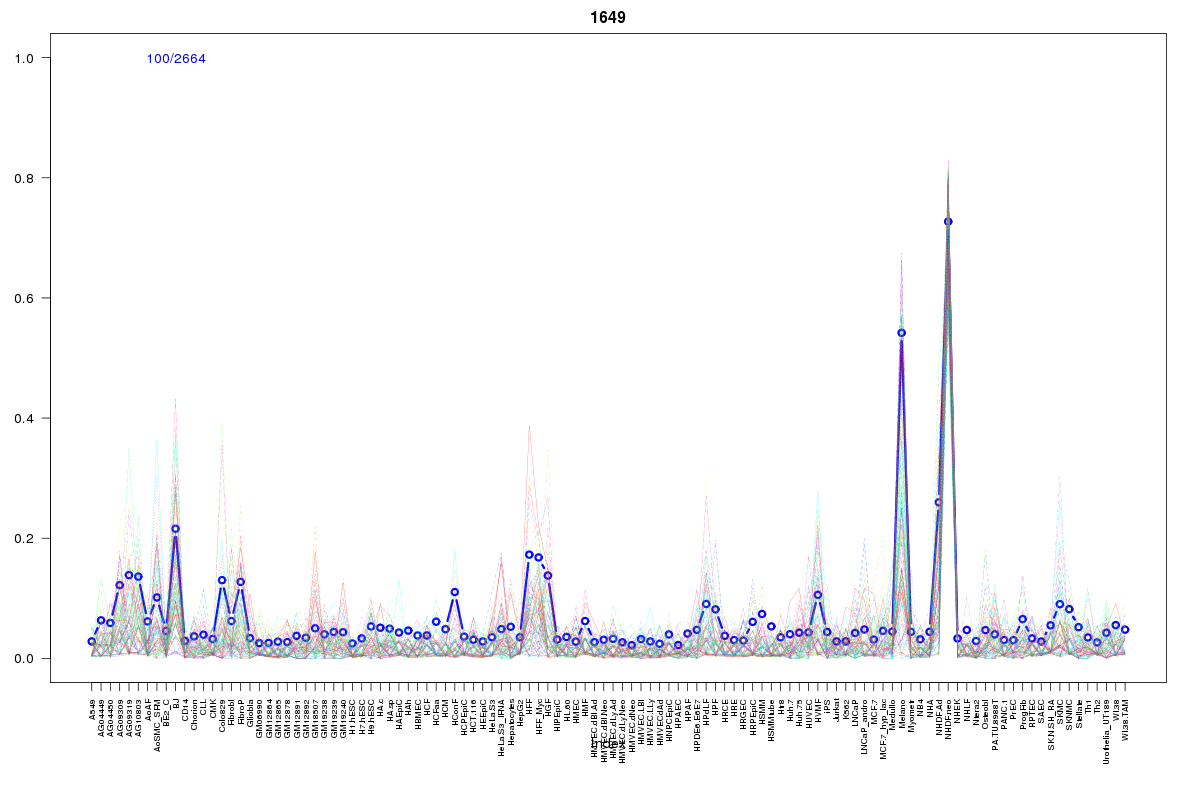
Cluster Hypersensitivity Profile

Genomic Location Trend
These plots show the distribution of the DHS sites surrounding the Transcript Start Site of the nearest gene.
Stats
Number of sites: 2664Promoter: 0%
CpG-Island: 0%
Conserved: 50%
Enriched Motifs & Matches
Match Detail: [Jaspar]
|
| ||
|---|---|---|
| Sites: 56/100 | e-val: 1.7e-22 | ||
| Factor | e-val(match) | DB |
| Foxq1 | 0.0000011401 | JASPAR |
| Foxd3 | 0.0000024116 | JASPAR |
| FOXO3 | 0.00036684 | JASPAR |
| MEF2A | 0.0013237 | JASPAR |
| HNF1A | 0.0019882 | JASPAR |
|
| ||
| Sites: 47/100 | e-val: 0.000000017 | ||
| Factor | e-val(match) | DB |
| Prrx2 | 0.00052485 | JASPAR |
| MEF2A | 0.0077716 | JASPAR |
| Pdx1 | 0.0079661 | JASPAR |
| NKX3-1 | 0.011196 | JASPAR |
| Nkx2-5 | 0.011734 | JASPAR |
BED file downloads
Top 10 Example Regions
| Location | Gene Link | Dist. |
|---|---|---|
| chr1: 92646280-92646430 | GAPDHP46 | 13.76 |
| chr4: 87798580-87798730 | AFF1 | 30.7 |
| chr12: 117094280-117094430 | RP11-497G19.1 | 34.02 |
| chr9: 110583600-110583750 | RN7SL659P | 37.22 |
| chr2: 1566540-1566690 | AC144450.2 | 42.68 |
| chr2: 30907500-30907650 | CAPN13 | 52.69 |
| chr8: 121042100-121042250 | COL14A1 | 53.23 |
| chr8: 71528060-71528210 | TRAM1 | 56.3 |
| chr8: 99356320-99356470 | KCNS2 | 56.36 |
| chr4: 144191520-144191670 | USP38 | 58.94 |