Gene: MATN1-AS1
chr1: 31191350-31199591Expression Profile
(log scale)
Graphical Connections
Distribution of linked clusters:
You may find it interesting if many of the connected DHS sites belong to the same cluster.| Cluster Profile | Cluster ID | Number of DHS sites in this cluster |
|---|---|---|
 | 615 | 13 |
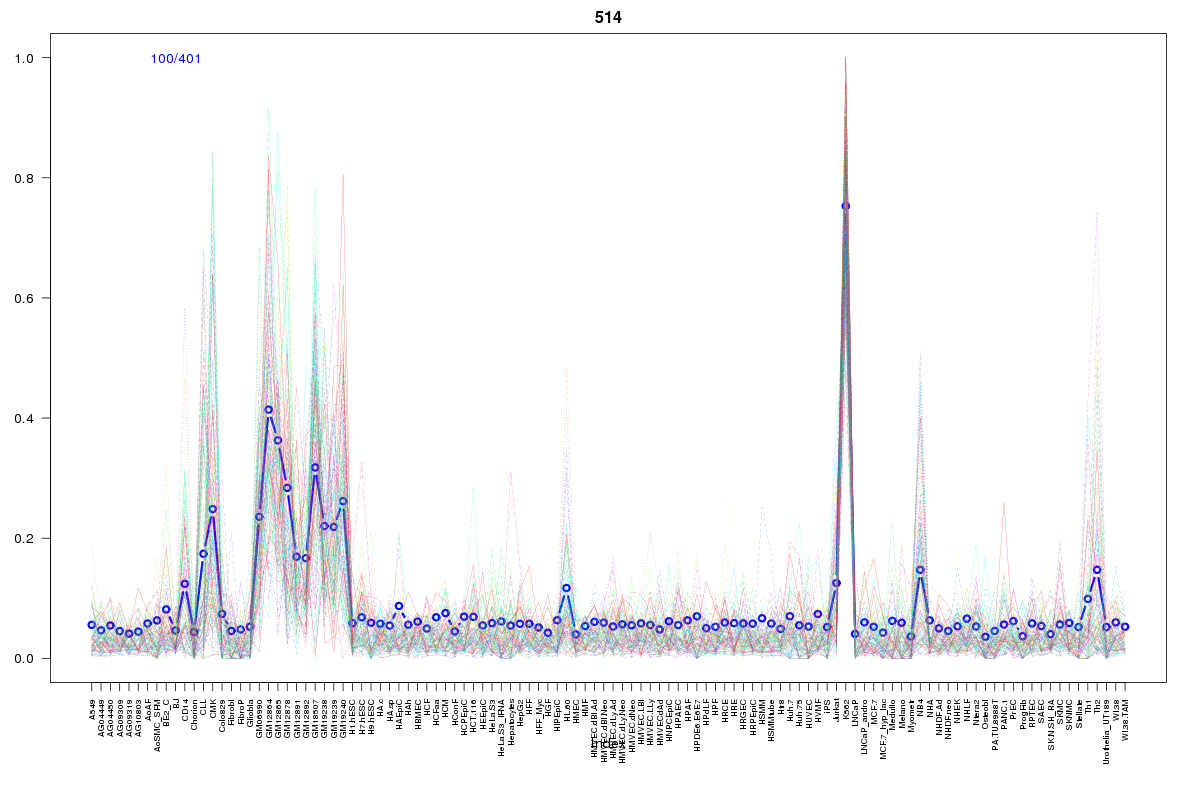 | 514 | 5 |
 | 1963 | 3 |
 | 2055 | 2 |
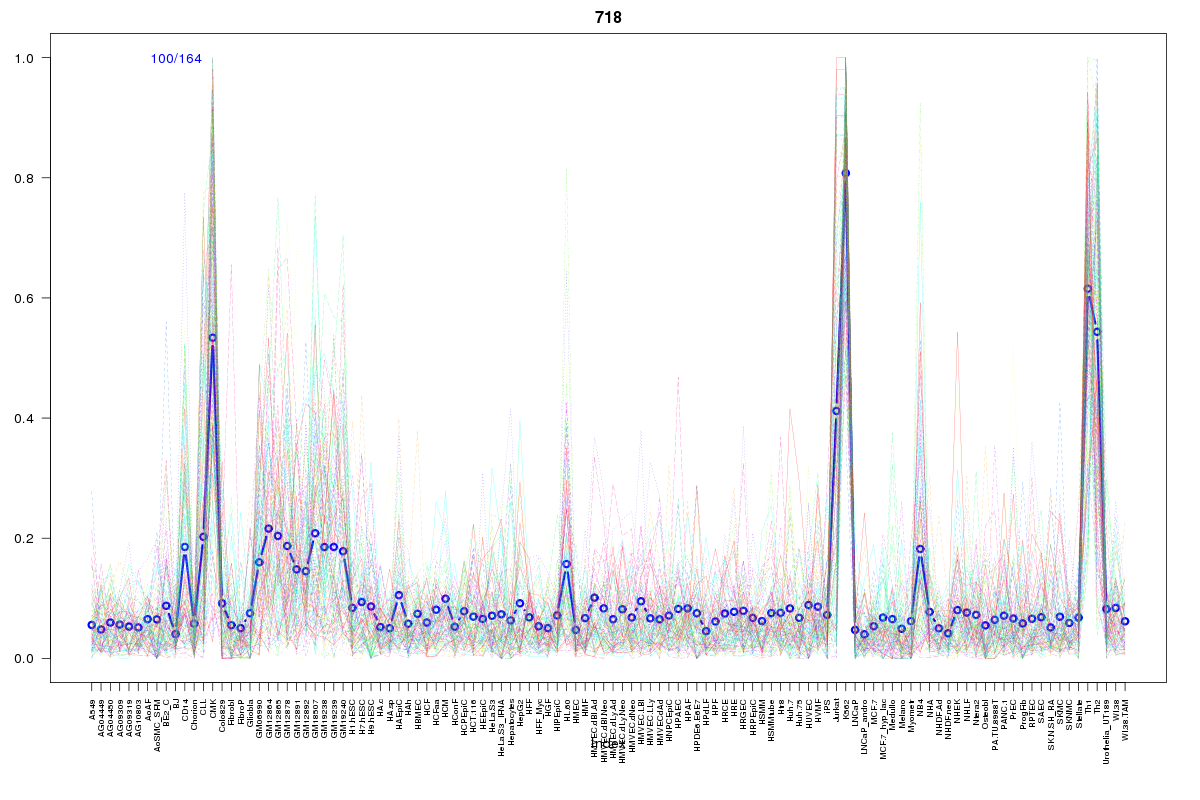 | 718 | 2 |
 | 687 | 2 |
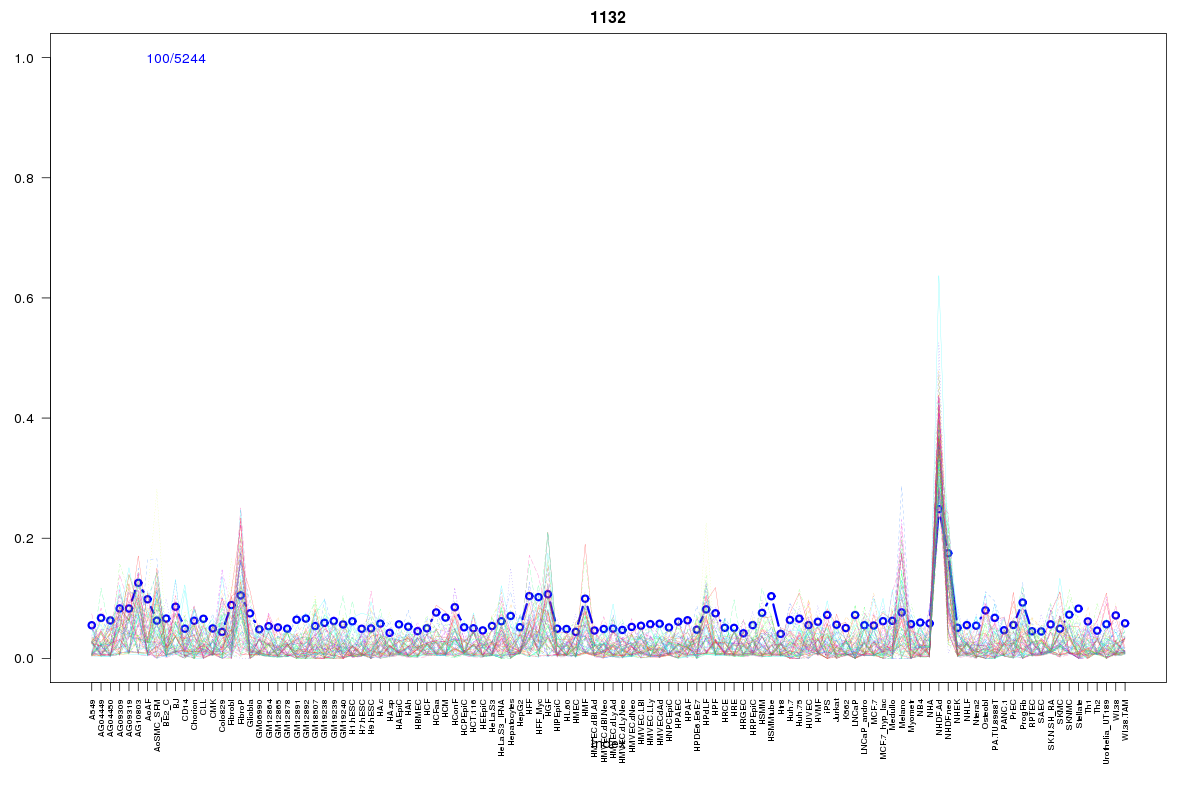 | 1132 | 2 |
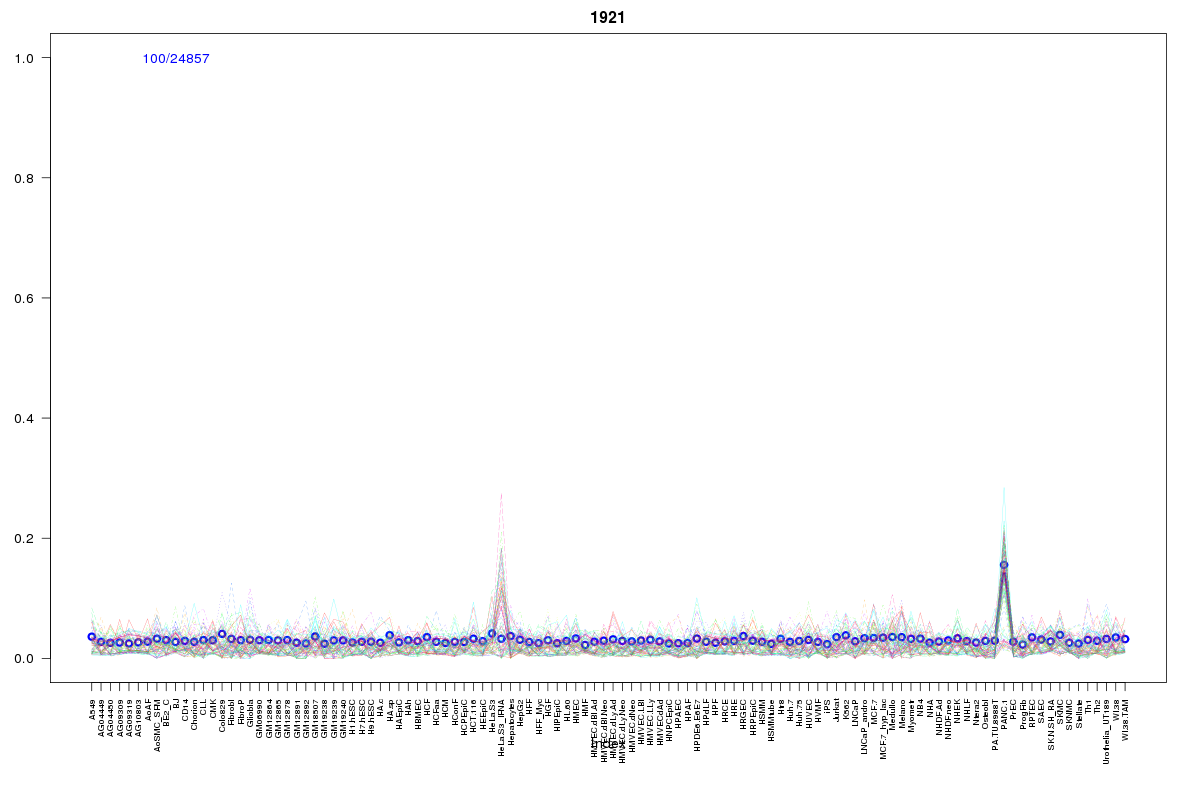 | 1921 | 1 |
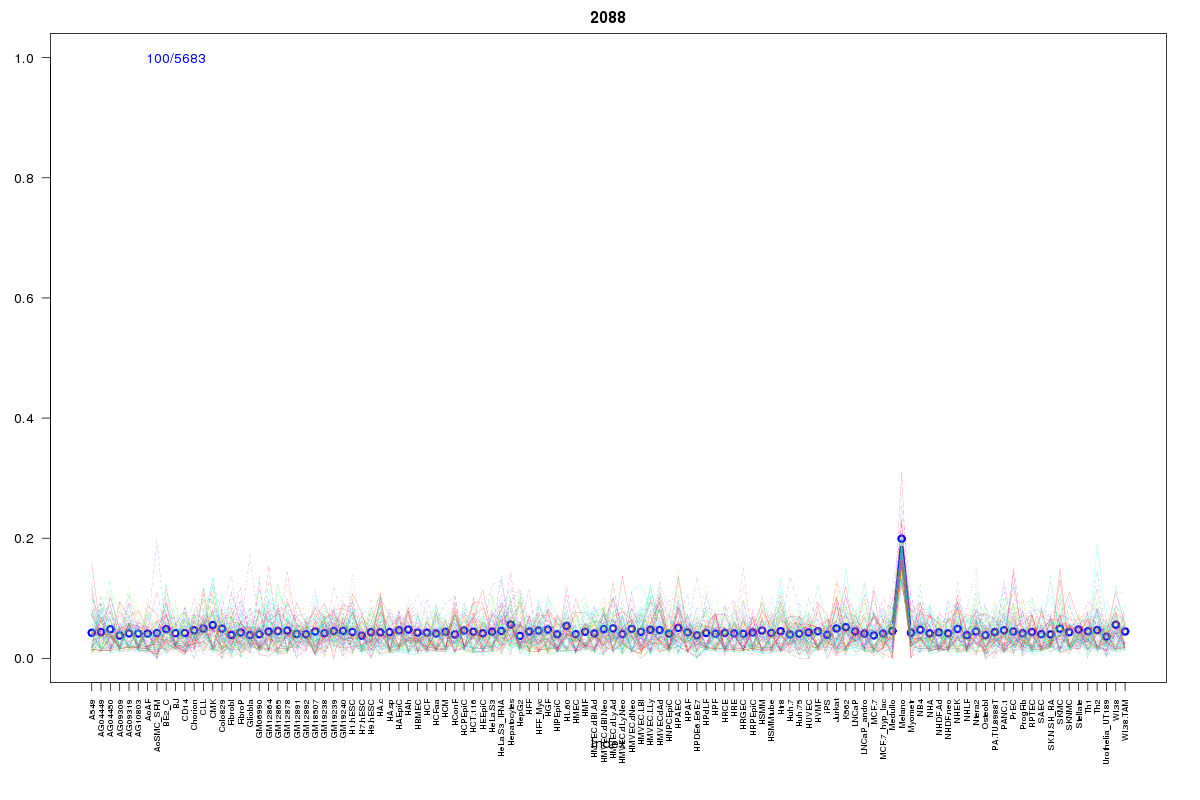 | 2088 | 1 |
 | 416 | 1 |
 | 1151 | 1 |
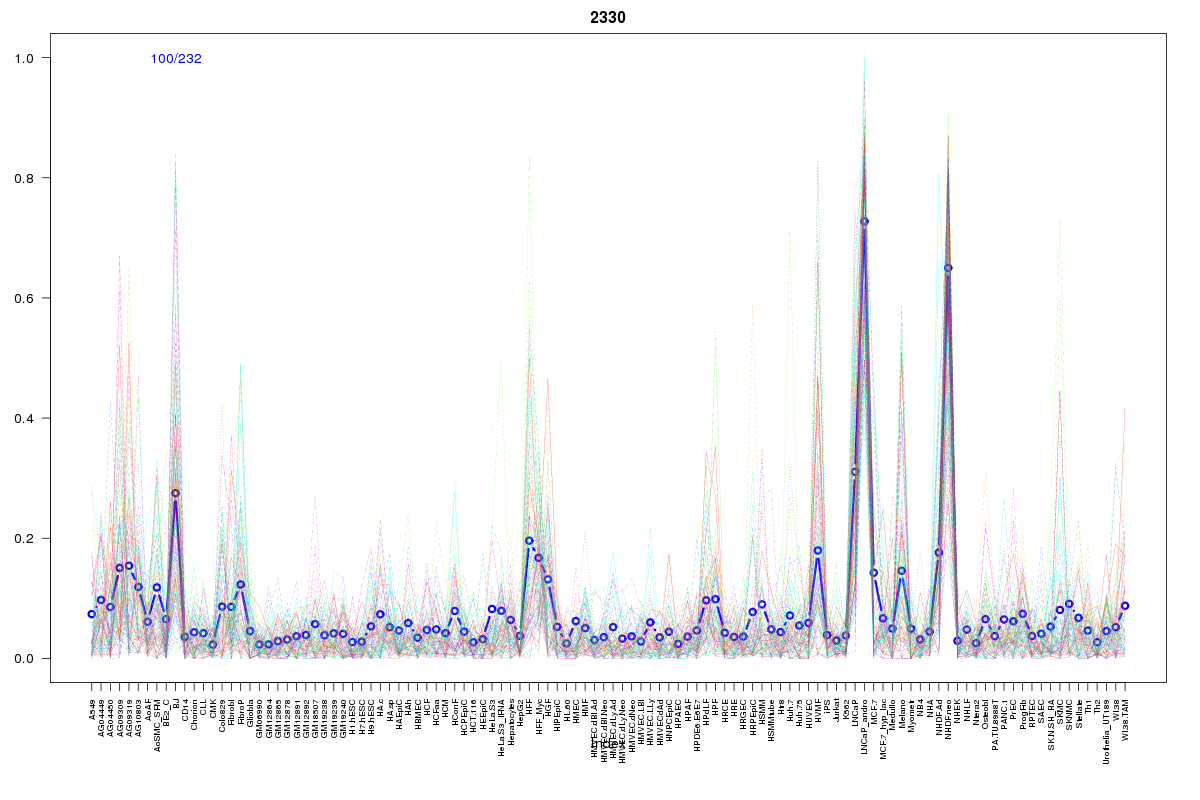 | 2330 | 1 |
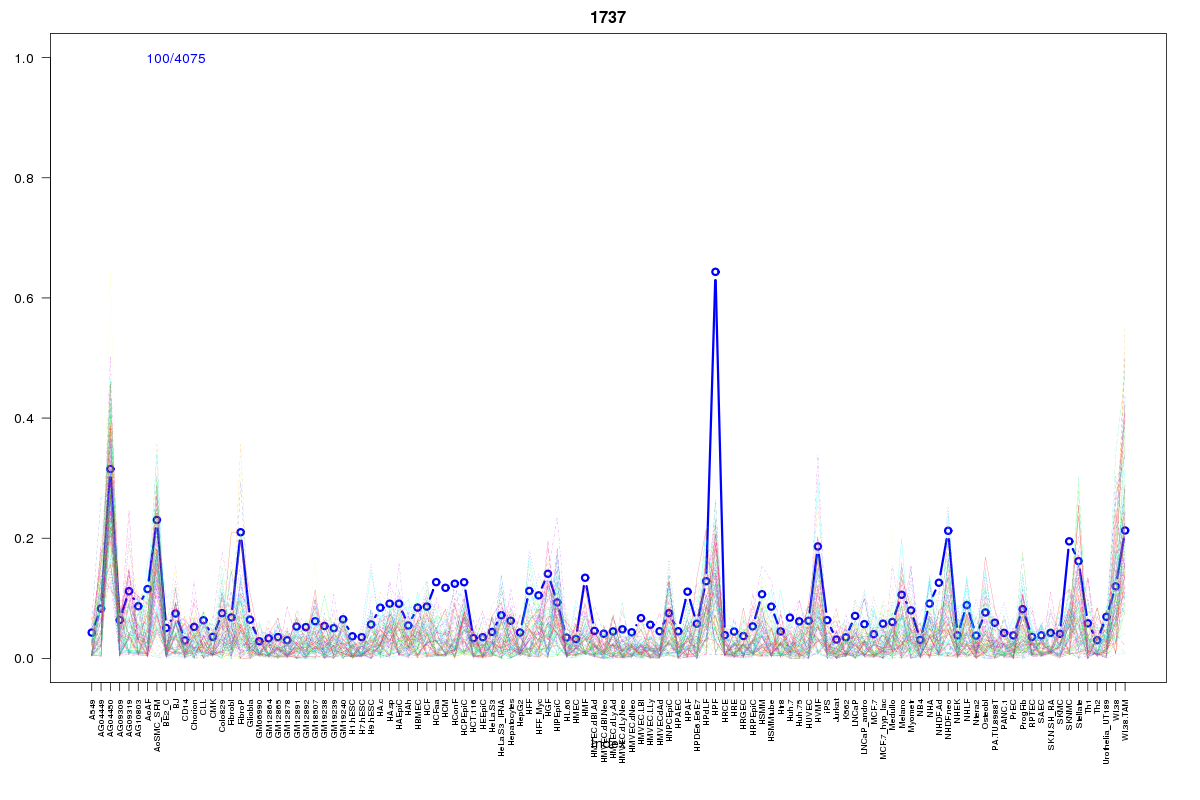 | 1737 | 1 |
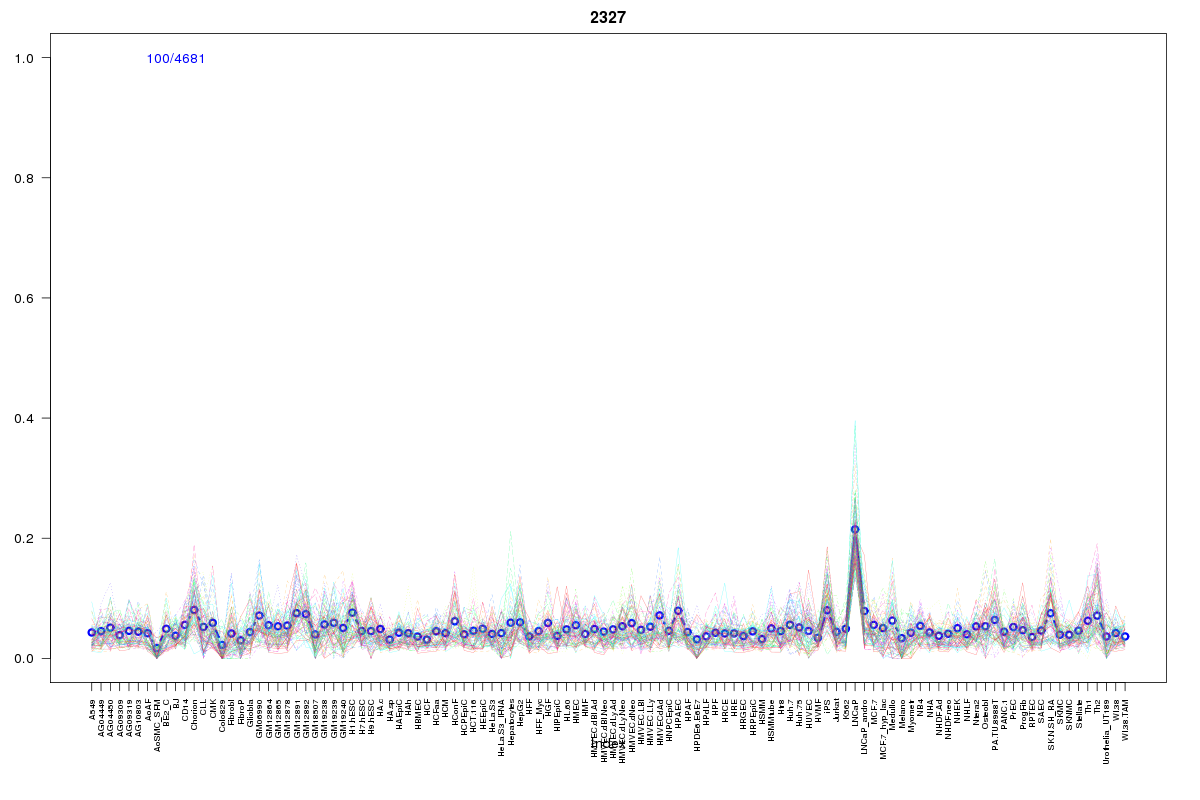 | 2327 | 1 |
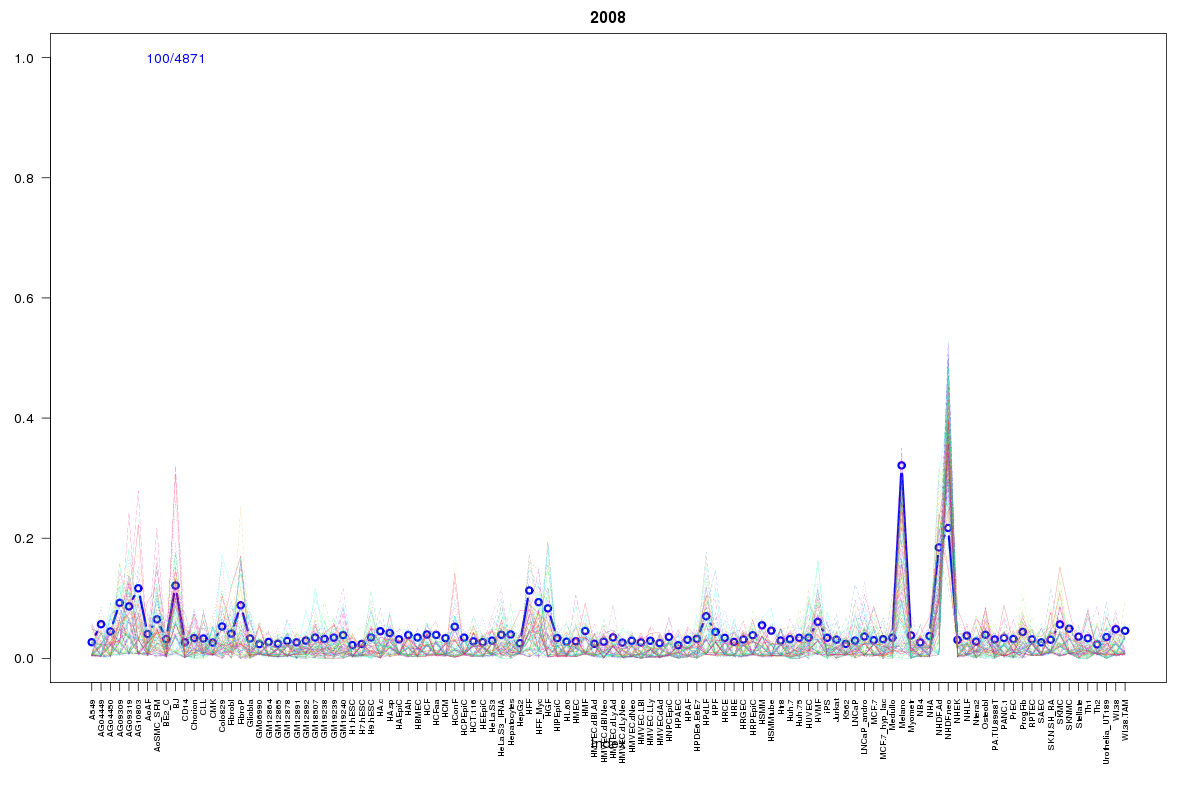 | 2008 | 1 |
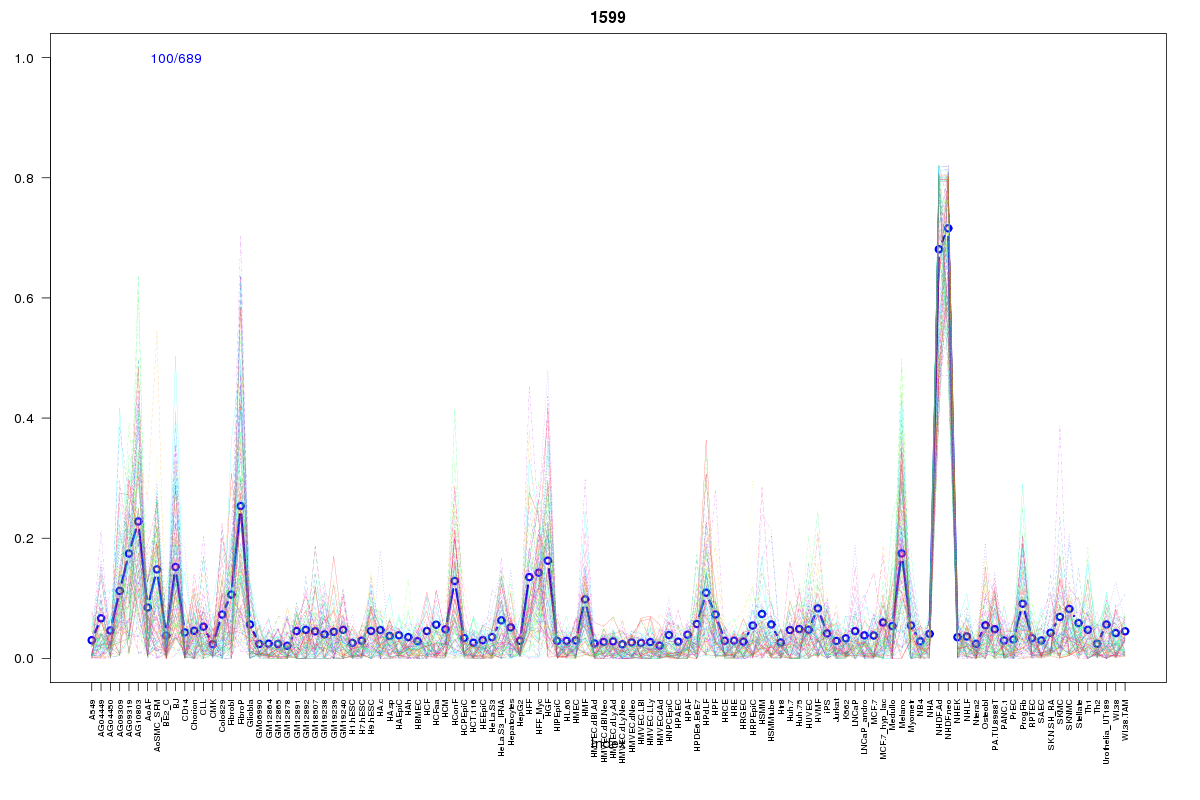 | 1599 | 1 |
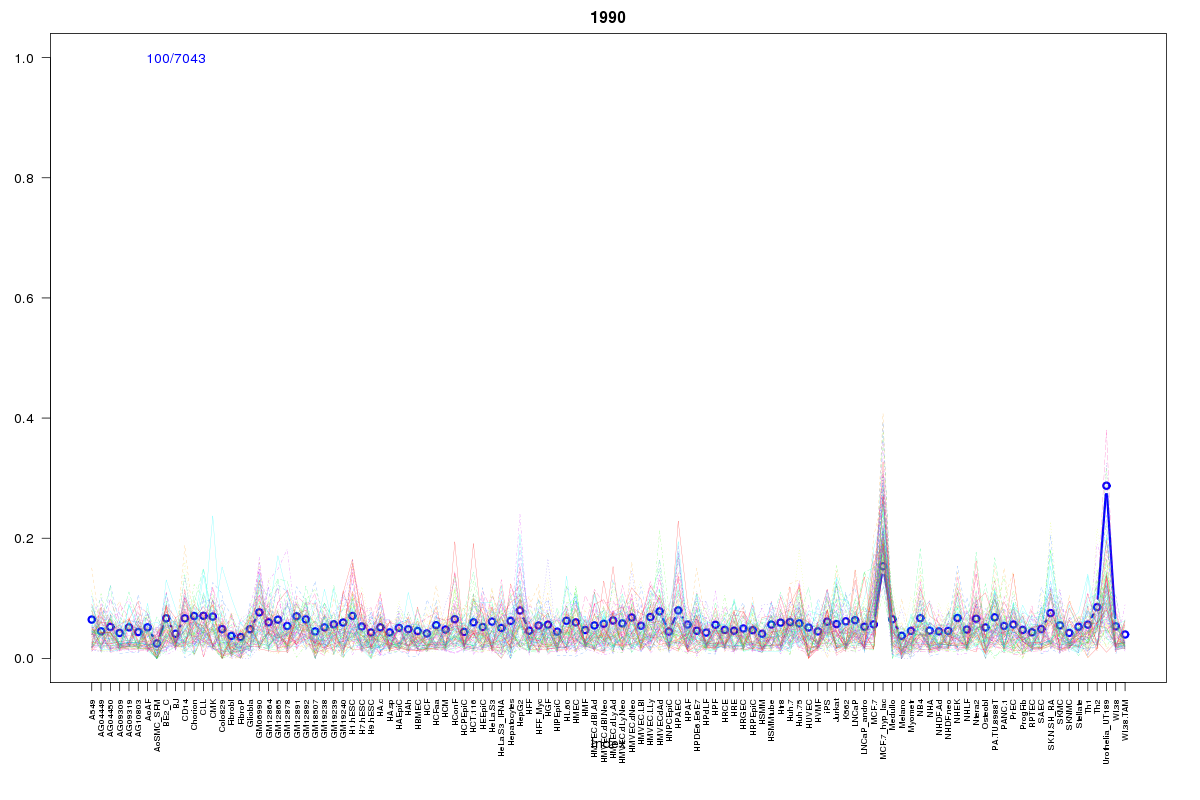 | 1990 | 1 |
 | 2017 | 1 |
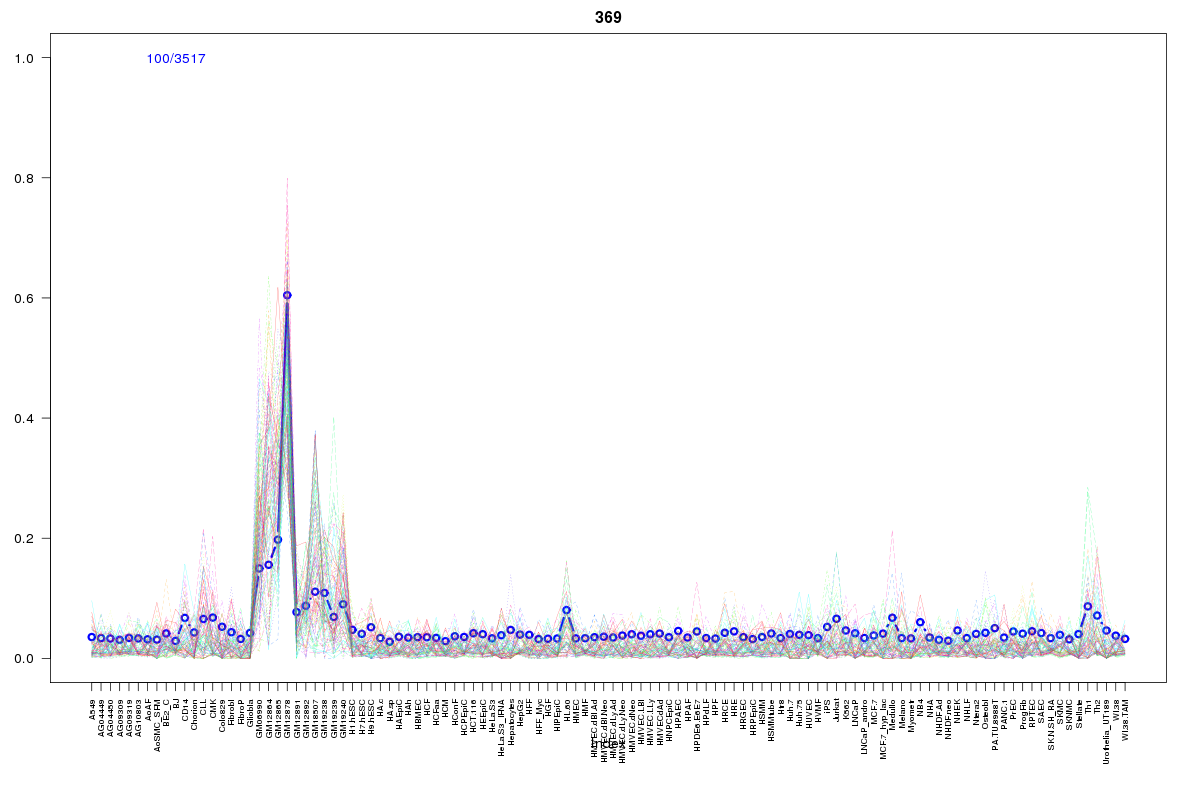 | 369 | 1 |
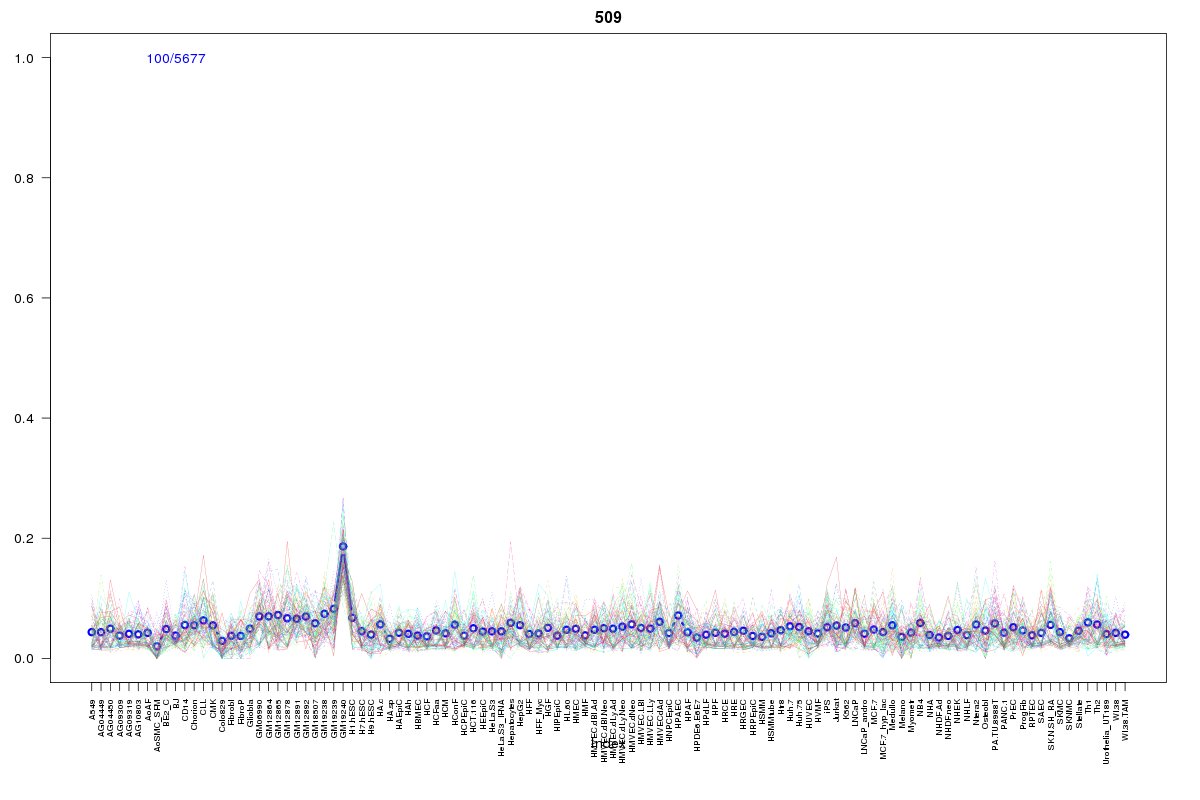 | 509 | 1 |
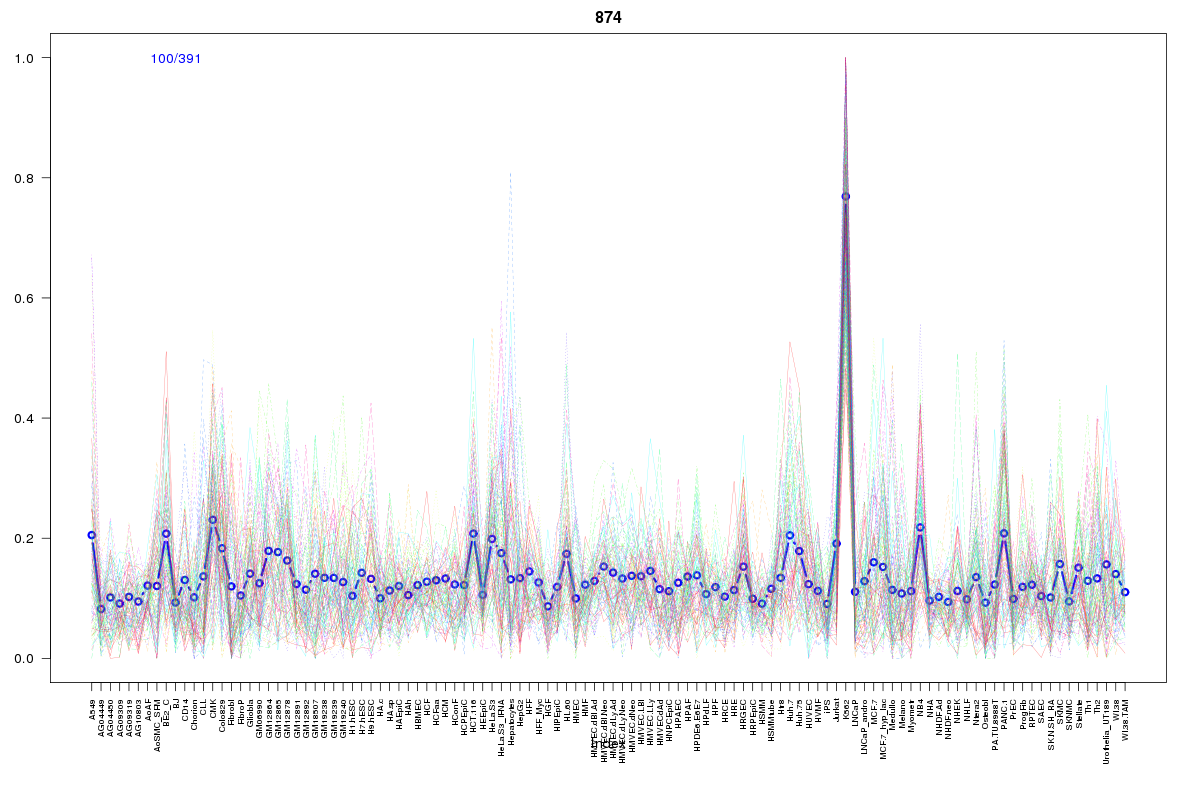 | 874 | 1 |
Resources
BED file downloads
Connects to 43 DHS sitesTop 10 Correlated DHS Sites
p-values indiciate significant higher or lower correlation| Location | Cluster | P-value |
|---|---|---|
| chr1:31204740-31204890 | 1963 | 0 |
| chr1:31243885-31244035 | 615 | 0.001 |
| chr1:31204520-31204670 | 615 | 0.003 |
| chr1:31250985-31251135 | 615 | 0.006 |
| chr1:31132720-31132870 | 615 | 0.007 |
| chr1:31211040-31211190 | 514 | 0.01 |
| chr1:31204140-31204290 | 615 | 0.01 |
| chr1:31201080-31201230 | 2055 | 0.01 |
| chr1:31243125-31243275 | 615 | 0.01 |
| chr1:31250440-31250590 | 1963 | 0.01 |
| chr1:31234400-31234550 | 514 | 0.01 |
External Databases
UCSCEnsembl (ENSG00000186056)