SOM cluster: 1599
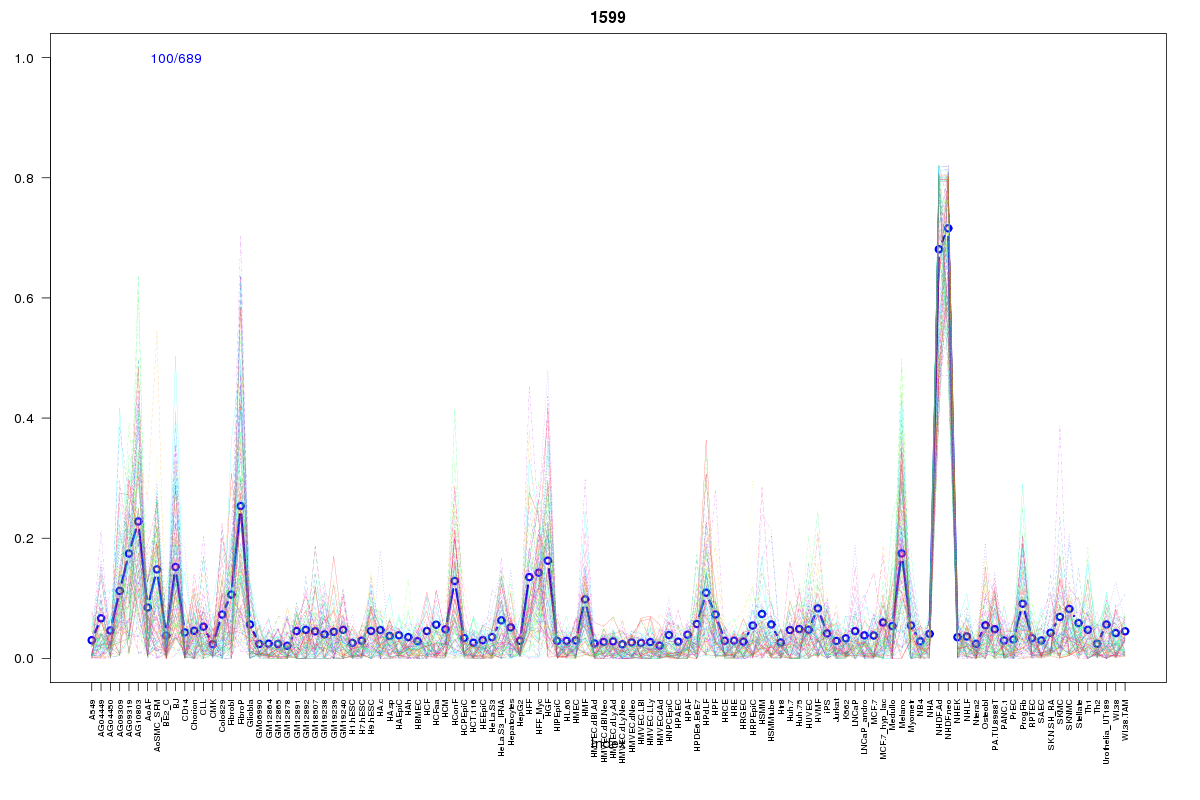
Cluster Hypersensitivity Profile

Genomic Location Trend
These plots show the distribution of the DHS sites surrounding the Transcript Start Site of the nearest gene.
Stats
Number of sites: 689Promoter: 0%
CpG-Island: 0%
Conserved: 57%
Enriched Motifs & Matches
Match Detail: [Jaspar]
|
| ||
|---|---|---|
| Sites: 43/100 | e-val: 0.00000000001 | ||
| Factor | e-val(match) | DB |
| Lhx3 | 0.0000063585 | JASPAR |
| ARID3A | 0.00059468 | JASPAR |
| Foxd3 | 0.00086355 | JASPAR |
| HNF1A | 0.0021225 | JASPAR |
| HNF1B | 0.0030752 | JASPAR |
BED file downloads
Top 10 Example Regions
| Location | Gene Link | Dist. |
|---|---|---|
| chr1: 145657080-145657230 | ANKRD35 | 21.83 |
| chr1: 59763980-59764130 | FGGY | 36.08 |
| chr5: 130993500-130993650 | FNIP1 | 53.05 |
| chr3: 73374080-73374230 | PDZRN3 | 53.6 |
| chr5: 102000080-102000230 | PAM | 55.06 |
| chr8: 121340780-121340930 | COL14A1 | 56.31 |
| chr1: 215219340-215219490 | KCNK2 | 57.05 |
| chr17: 54347240-54347390 | ANKFN1 | 58.68 |
| chr6: 127498600-127498750 | RSPO3 | 59.69 |
| chr4: 148734720-148734870 | ARHGAP10 | 64.75 |