Gene: THNSL1
chr10: 25305586-25315593Expression Profile
(log scale)
Graphical Connections
Distribution of linked clusters:
You may find it interesting if many of the connected DHS sites belong to the same cluster.| Cluster Profile | Cluster ID | Number of DHS sites in this cluster |
|---|---|---|
 | 10 | 2 |
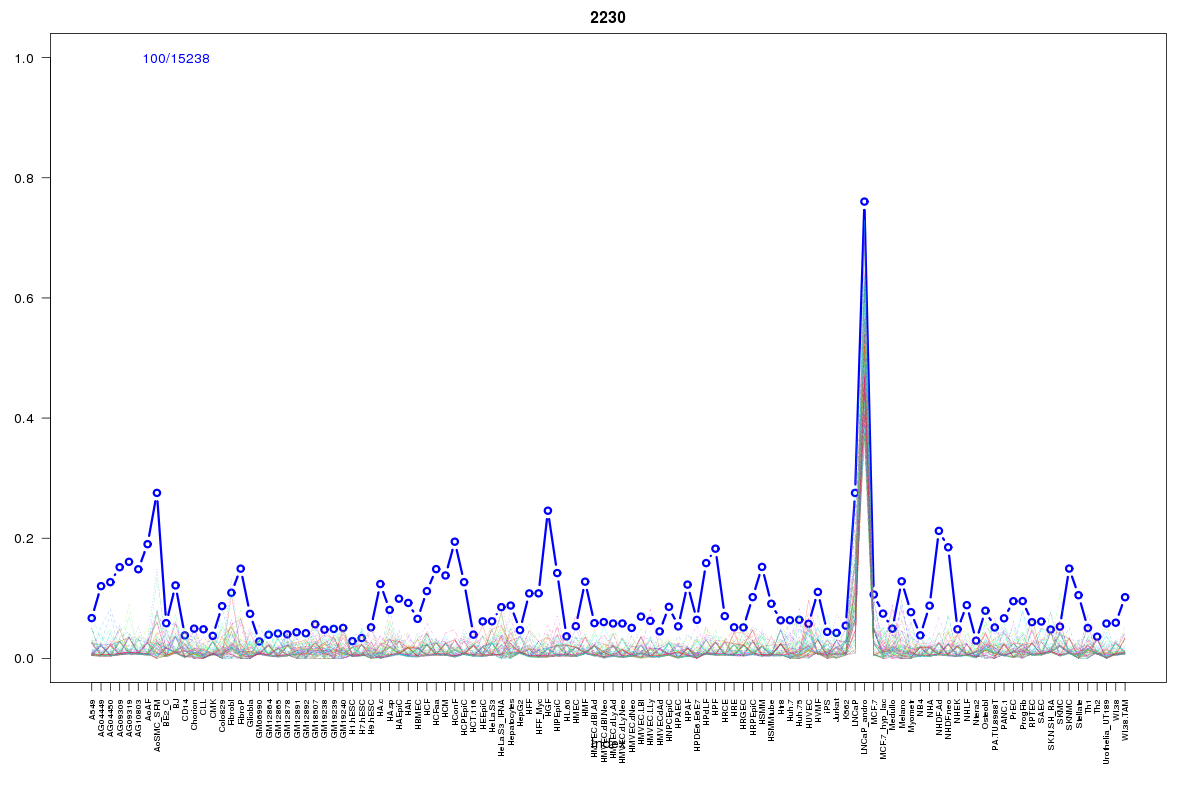 | 2230 | 1 |
 | 860 | 1 |
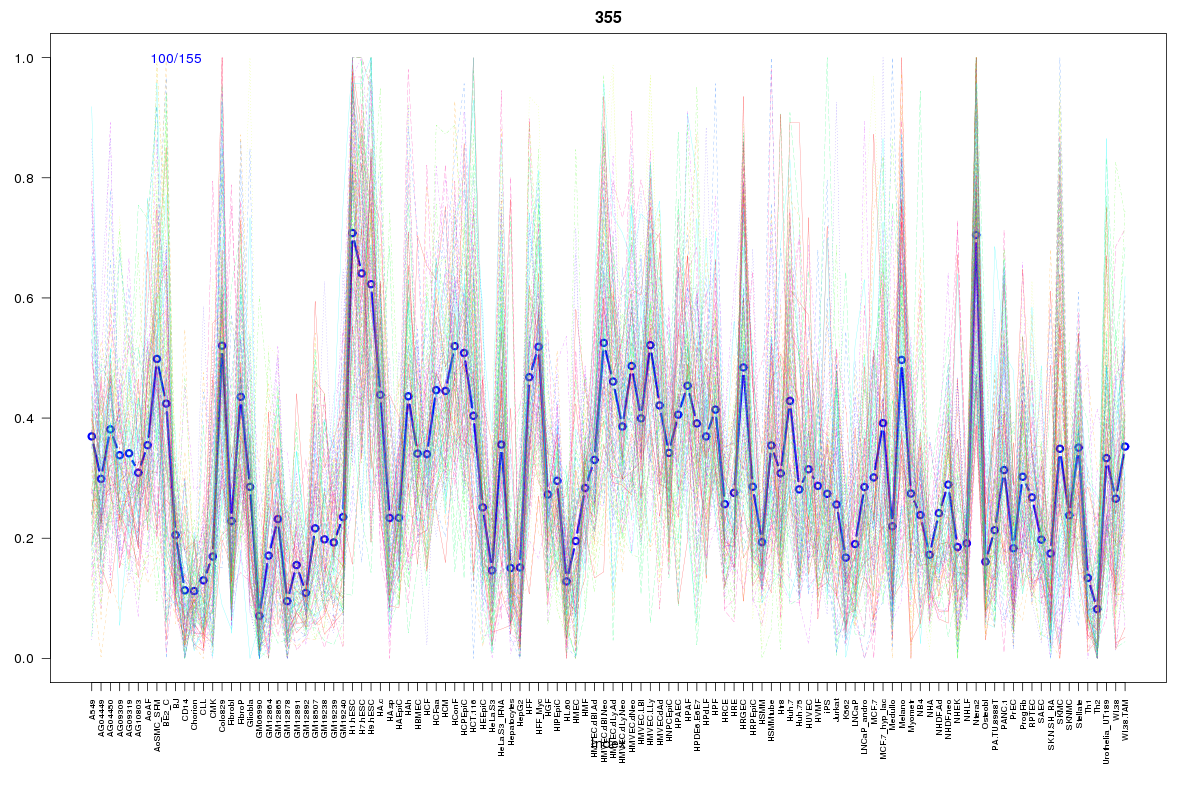 | 355 | 1 |
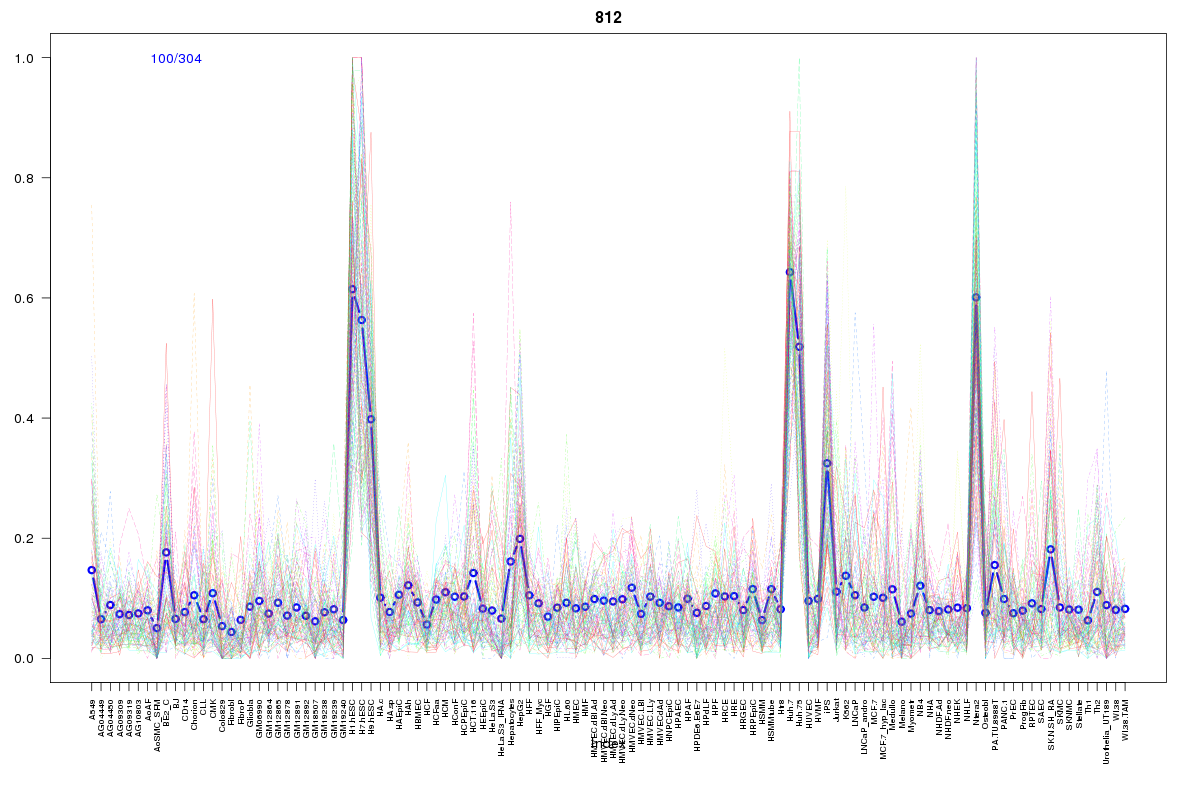 | 812 | 1 |
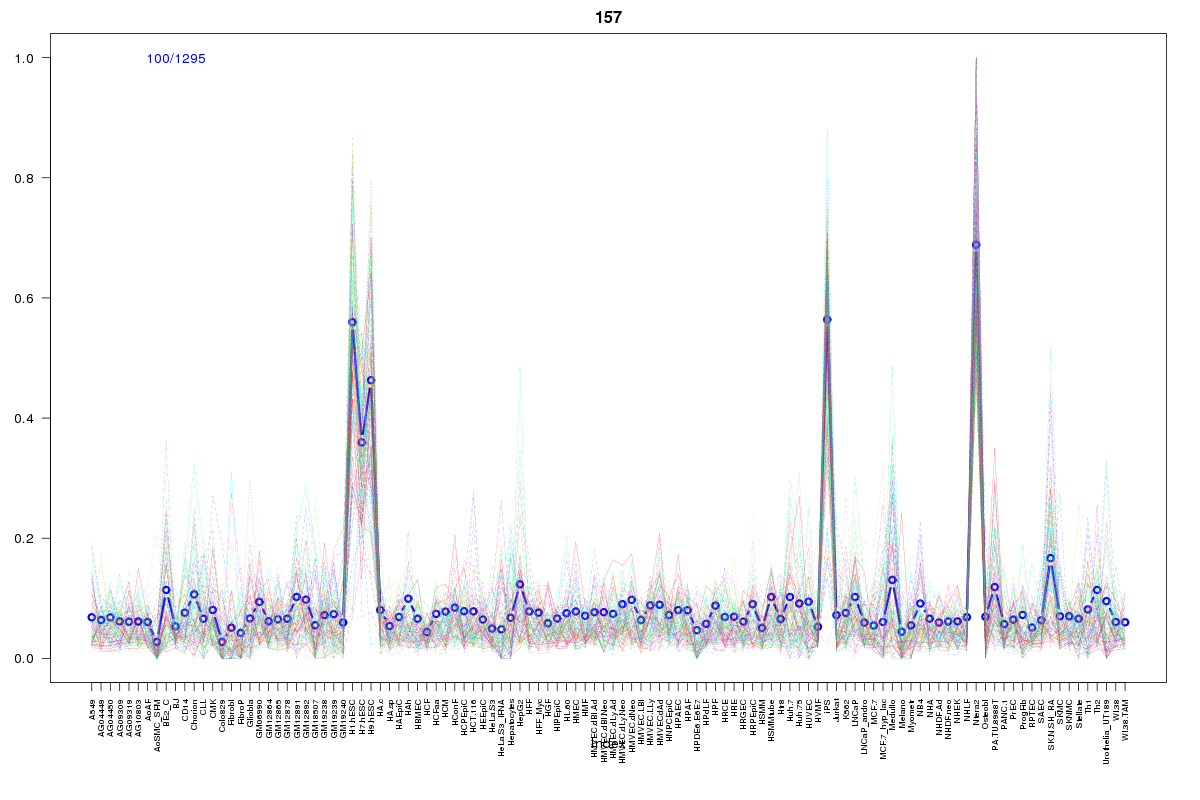 | 157 | 1 |
 | 946 | 1 |
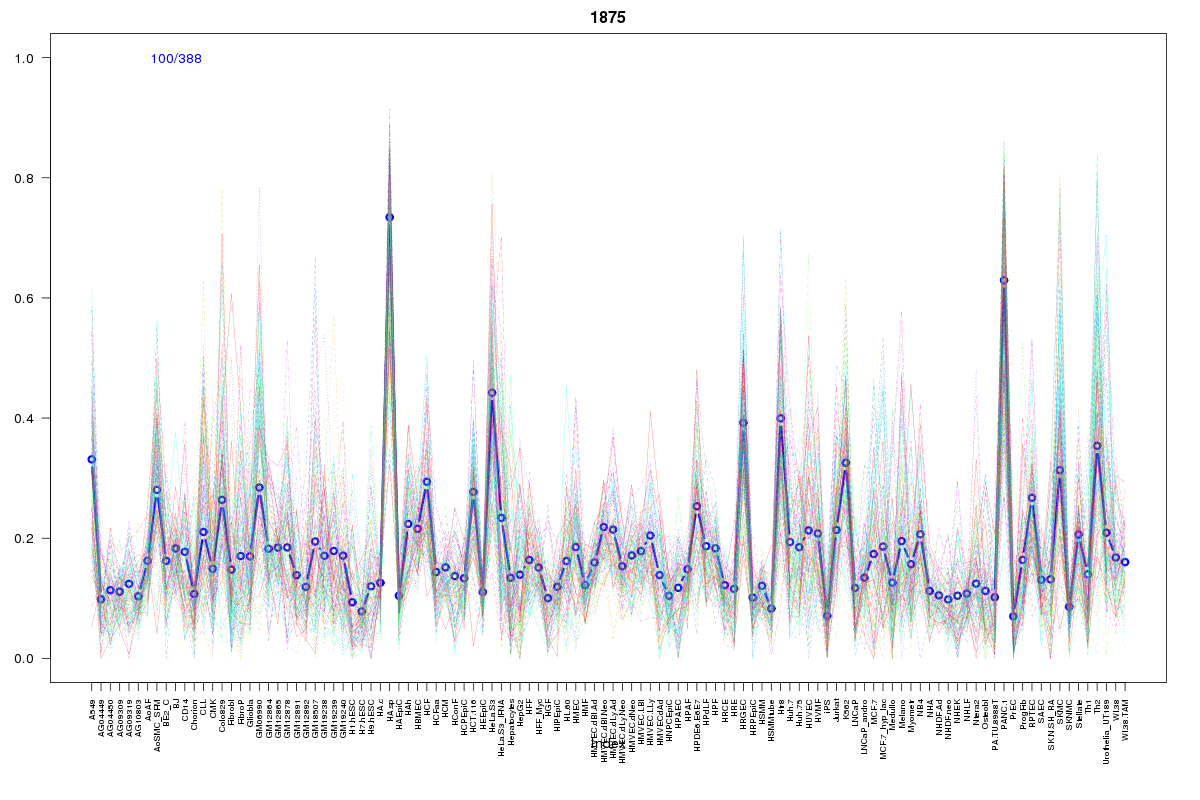 | 1875 | 1 |
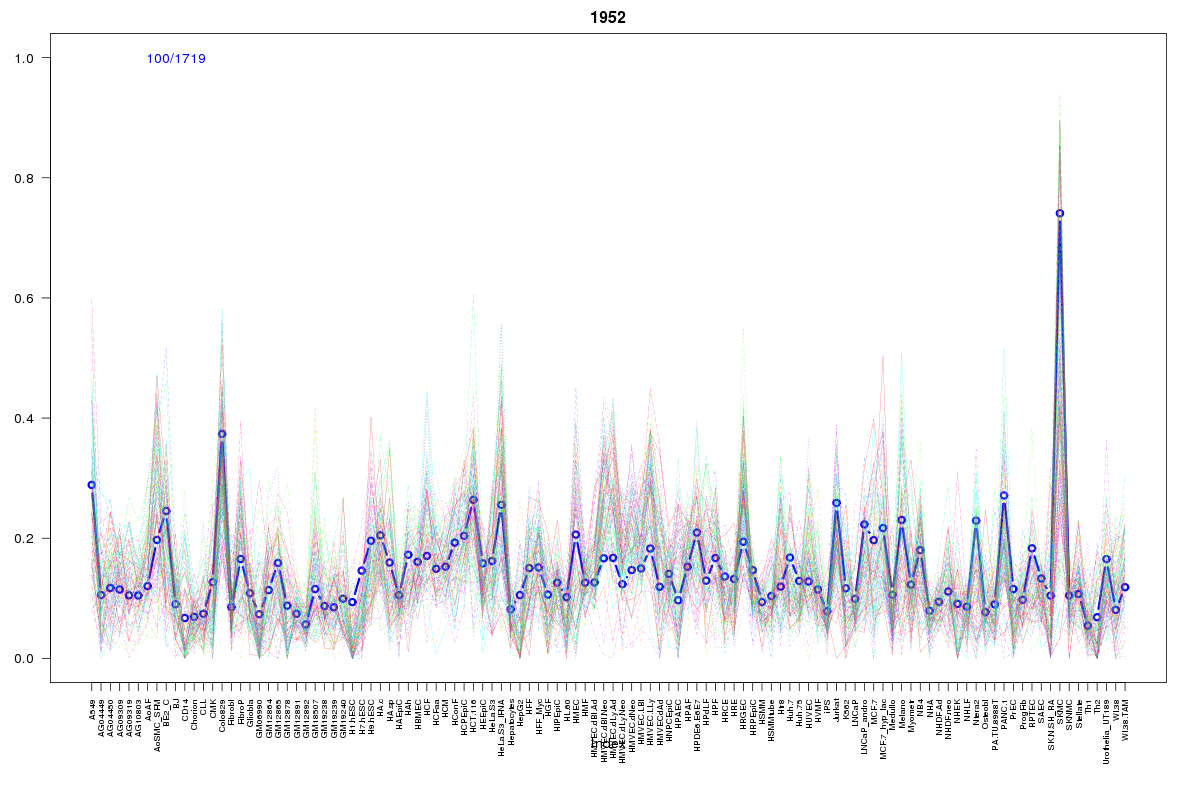 | 1952 | 1 |
Resources
BED file downloads
Connects to 10 DHS sitesTop 10 Correlated DHS Sites
p-values indiciate significant higher or lower correlation| Location | Cluster | P-value |
|---|---|---|
| chr10:25240900-25241050 | 157 | 0.004 |
| chr10:25402240-25402390 | 355 | 0.005 |
| chr10:25390805-25390955 | 860 | 0.01 |
| chr10:25371760-25371910 | 10 | 0.018 |
| chr10:25240440-25240590 | 812 | 0.018 |
| chr10:25306300-25306450 | 1952 | 0.023 |
| chr10:25304785-25304935 | 1875 | 0.023 |
| chr10:25394780-25394930 | 10 | 0.023 |
| chr10:25390480-25390630 | 2230 | 0.024 |
| chr10:25247120-25247270 | 946 | 0.005 |
External Databases
UCSCEnsembl (ENSG00000185875)