SOM cluster: 812
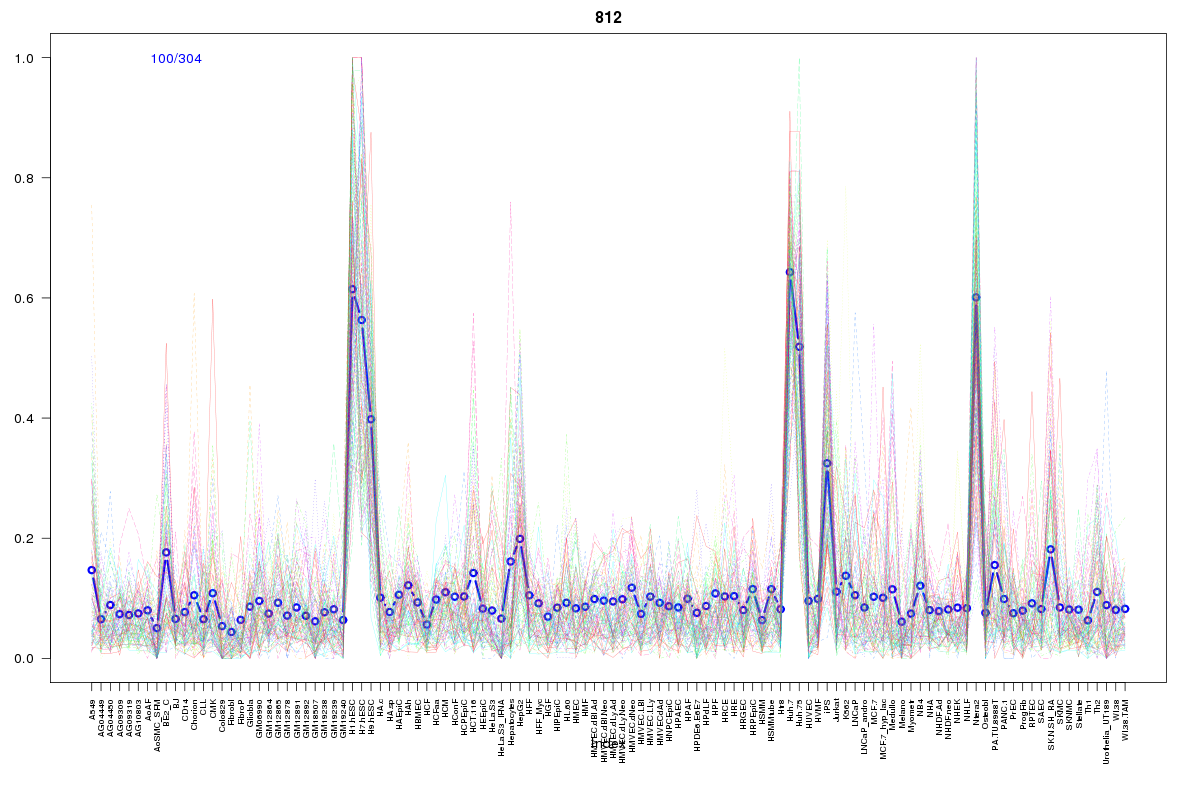
Cluster Hypersensitivity Profile

Genomic Location Trend
These plots show the distribution of the DHS sites surrounding the Transcript Start Site of the nearest gene.
Stats
Number of sites: 304Promoter: 13%
CpG-Island: 33%
Conserved: 44%
Enriched Motifs & Matches
Match Detail: [Jaspar]
|
| ||
|---|---|---|
| Sites: 56/100 | e-val: 2.1e-17 | ||
| Factor | e-val(match) | DB |
| SP1 | 0.000039892 | JASPAR |
| Egr1 | 0.001621 | JASPAR |
| Zfx | 0.0032598 | JASPAR |
| TFAP2A | 0.0051318 | JASPAR |
| CTCF | 0.0080757 | JASPAR |
BED file downloads
Top 10 Example Regions
| Location | Gene Link | Dist. |
|---|---|---|
| chr16: 79295545-79295695 | WWOX | 47.8 |
| chr11: 66493140-66493290 | SPTBN2 | 50.81 |
| chr11: 66493140-66493290 | RP11-658F2.8 | 50.81 |
| chr3: 133645885-133646035 | C3orf36 | 58.48 |
| chr12: 109746805-109746955 | FOXN4 | 62.1 |
| chr3: 18485505-18485655 | SATB1 | 62.77 |
| chr7: 47621885-47622035 | AC095067.1 | 62.92 |
| chr12: 31966380-31966530 | AMN1 | 62.97 |
| chr2: 73146165-73146315 | SFXN5 | 62.98 |
| chr19: 18909320-18909470 | CERS1 | 63.65 |