SOM cluster: 1875
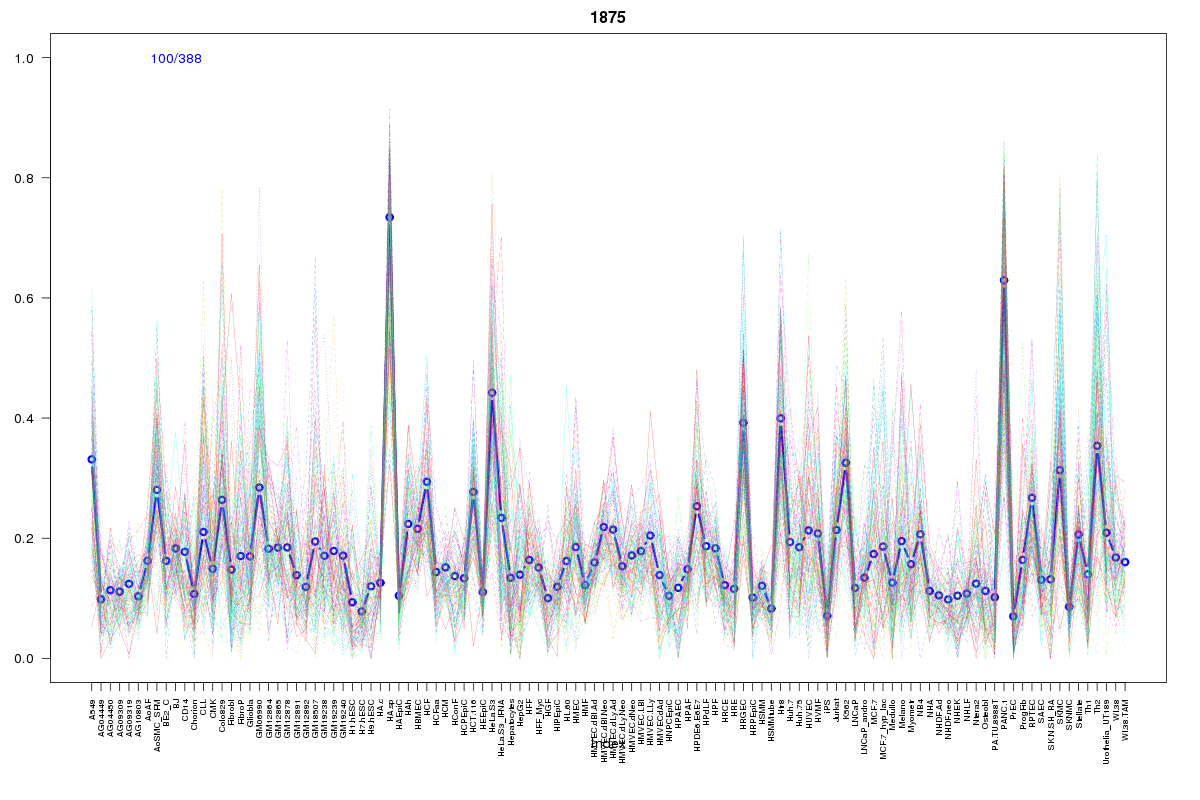
Cluster Hypersensitivity Profile

Genomic Location Trend
These plots show the distribution of the DHS sites surrounding the Transcript Start Site of the nearest gene.
Stats
Number of sites: 388Promoter: 68%
CpG-Island: 3%
Conserved: 21%
Enriched Motifs & Matches
Match Detail: [Jaspar]
|
| ||
|---|---|---|
| Sites: 57/100 | e-val: 0.00000000000089 | ||
| Factor | e-val(match) | DB |
| MEF2A | 0.000054206 | JASPAR |
| Foxd3 | 0.00053387 | JASPAR |
| Foxq1 | 0.001615 | JASPAR |
| ARID3A | 0.0046587 | JASPAR |
| Nkx2-5 | 0.0062747 | JASPAR |
BED file downloads
Top 10 Example Regions
| Location | Gene Link | Dist. |
|---|---|---|
| chr1: 145398140-145398290 | ANKRD34A | 15.08 |
| chr1: 198904380-198904530 | MIR181A1HG | 26.12 |
| chr5: 118406060-118406210 | CTB-161M19.2 | 32.75 |
| chr3: 150320685-150320835 | SERP1 | 38.21 |
| chr3: 150320685-150320835 | EIF2A | 38.21 |
| chr3: 150320685-150320835 | SELT | 38.21 |
| chr3: 169489460-169489610 | MYNN | 38.73 |
| chrX: 77155140-77155290 | COX7B | 50.33 |
| chrX: 77155140-77155290 | ATP7A | 50.33 |
| chr14: 32030285-32030435 | CTD-2213F21.4 | 53.65 |