Gene: STAC3
chr12: 57637235-57644976Expression Profile
(log scale)
Graphical Connections
Distribution of linked clusters:
You may find it interesting if many of the connected DHS sites belong to the same cluster.| Cluster Profile | Cluster ID | Number of DHS sites in this cluster |
|---|---|---|
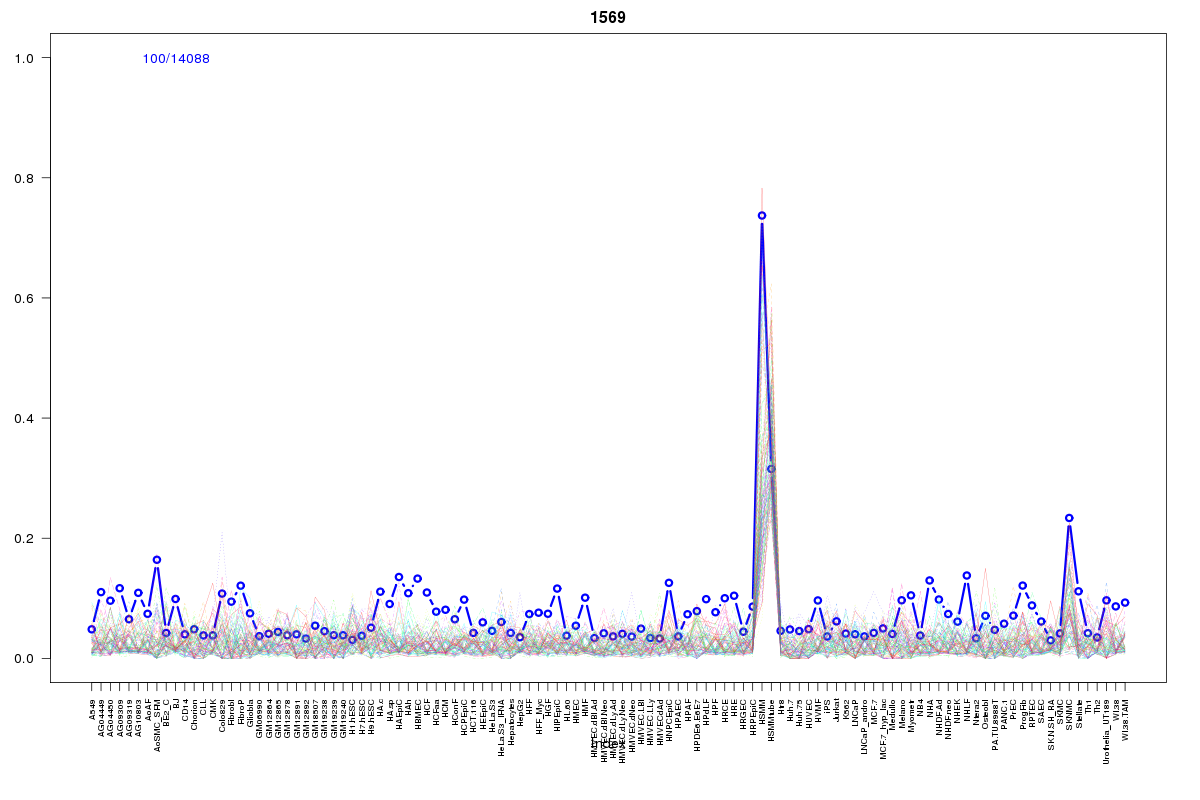 | 1569 | 4 |
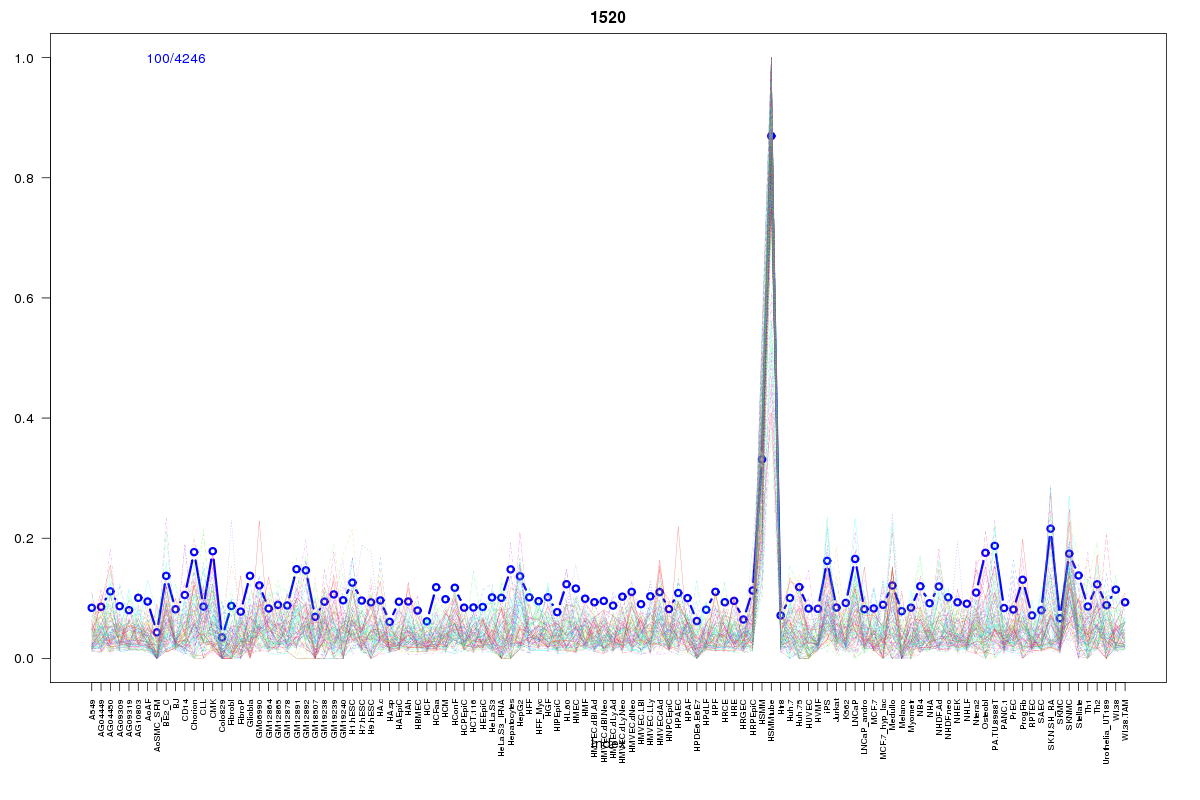 | 1520 | 2 |
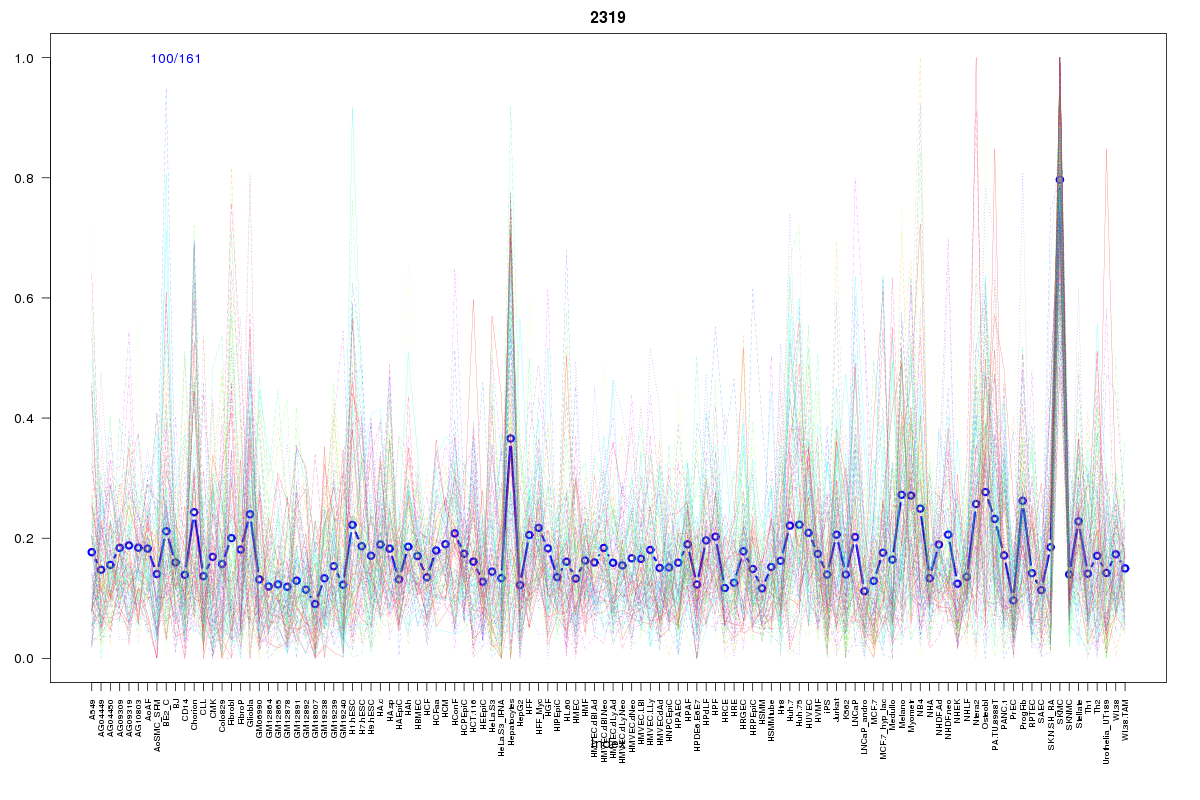 | 2319 | 1 |
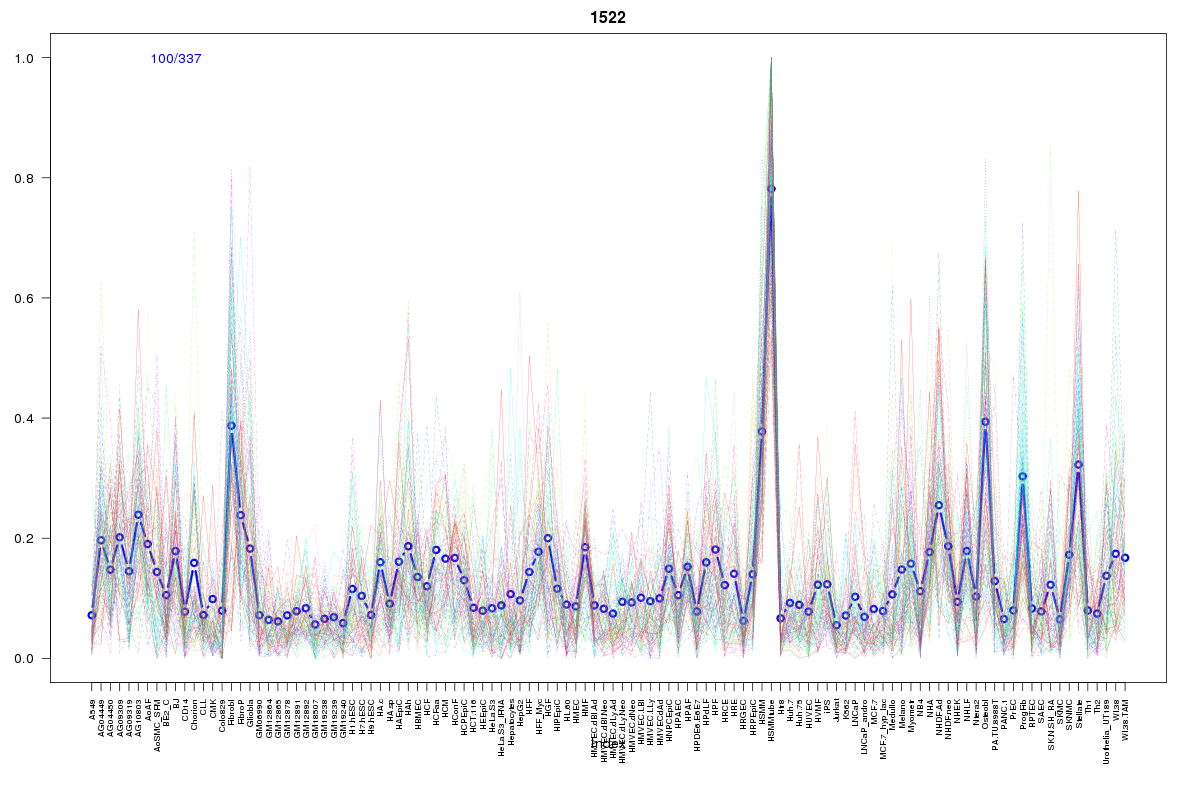 | 1522 | 1 |
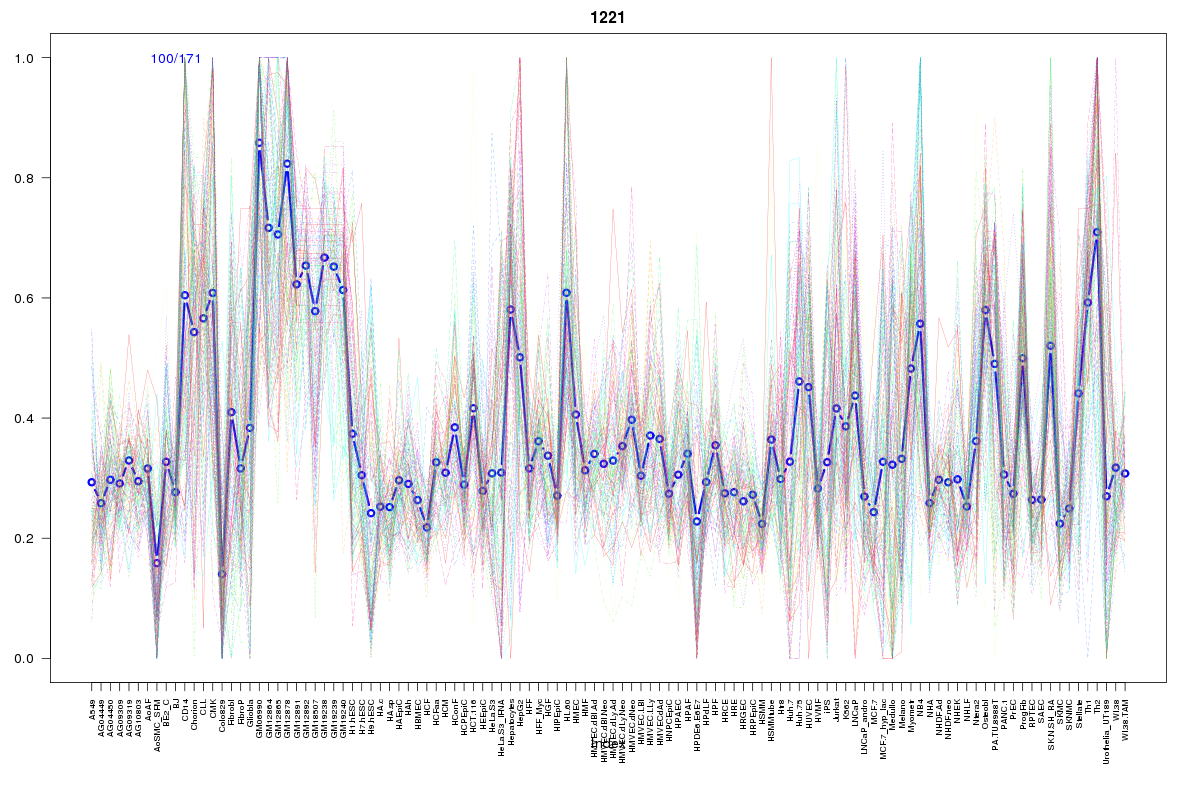 | 1221 | 1 |
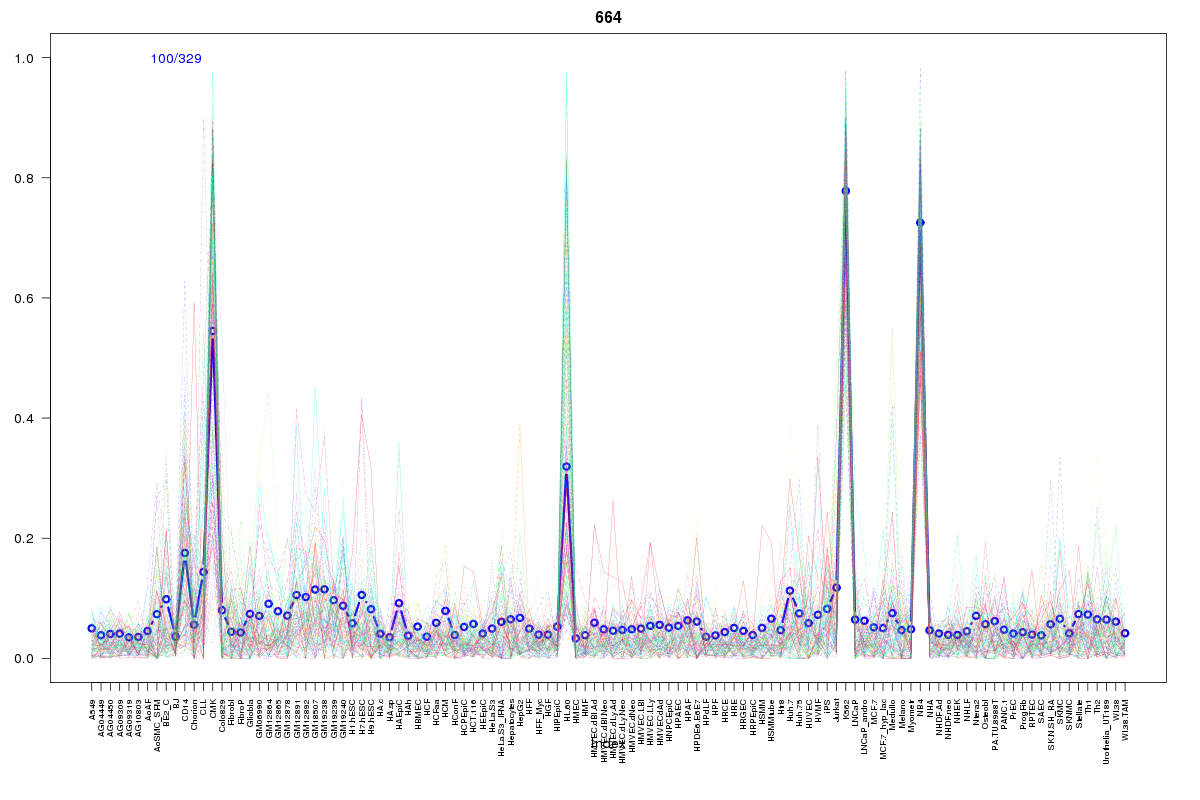 | 664 | 1 |
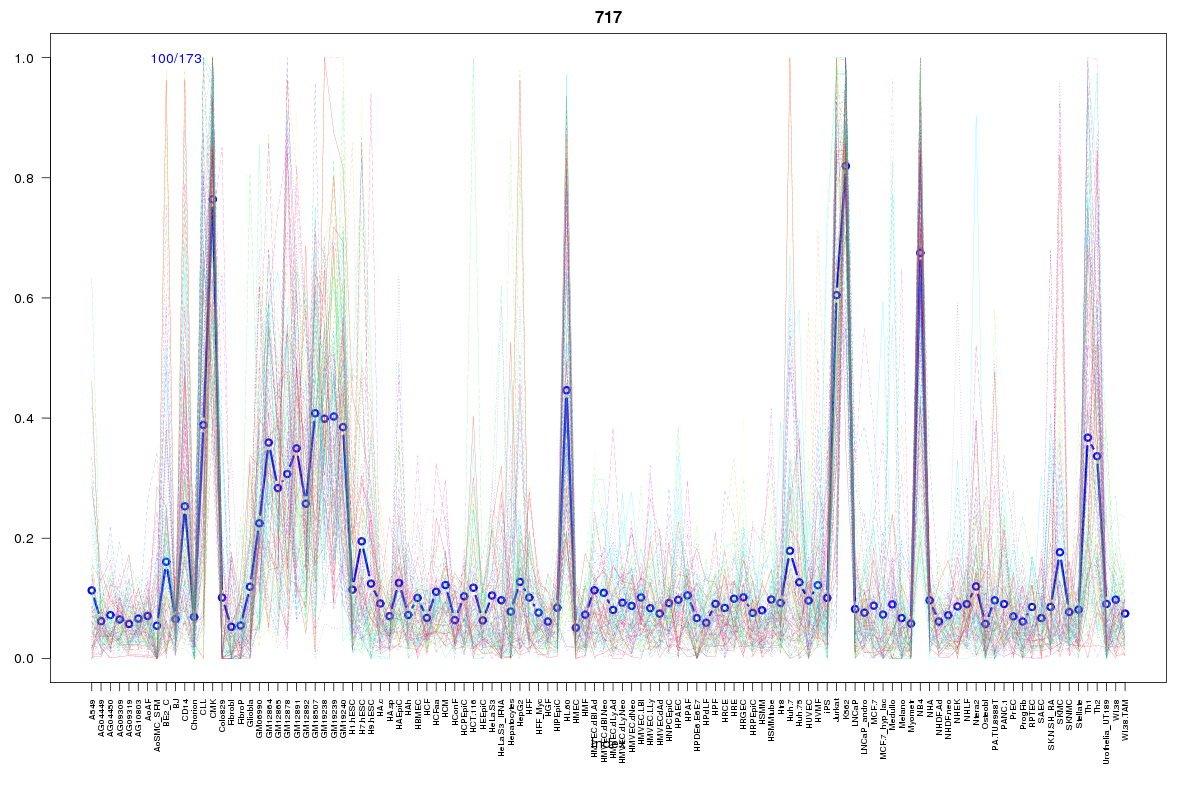 | 717 | 1 |
 | 1721 | 1 |
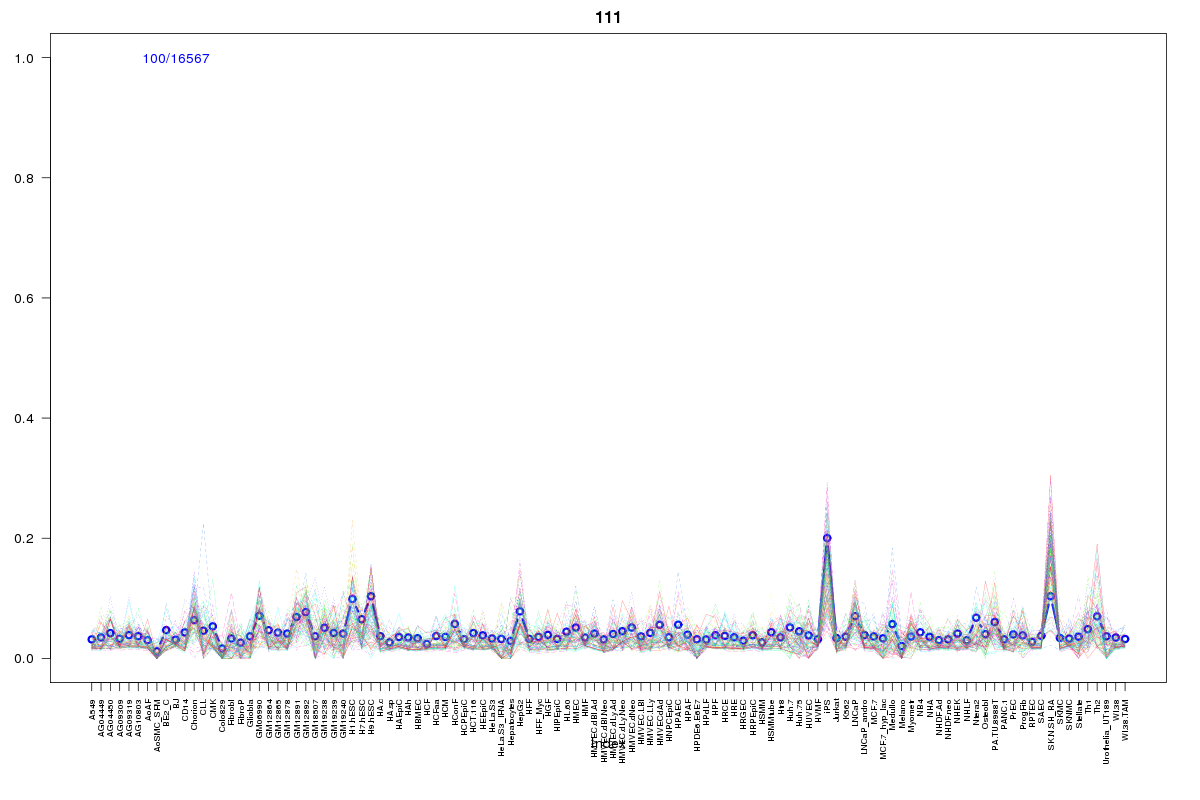 | 111 | 1 |
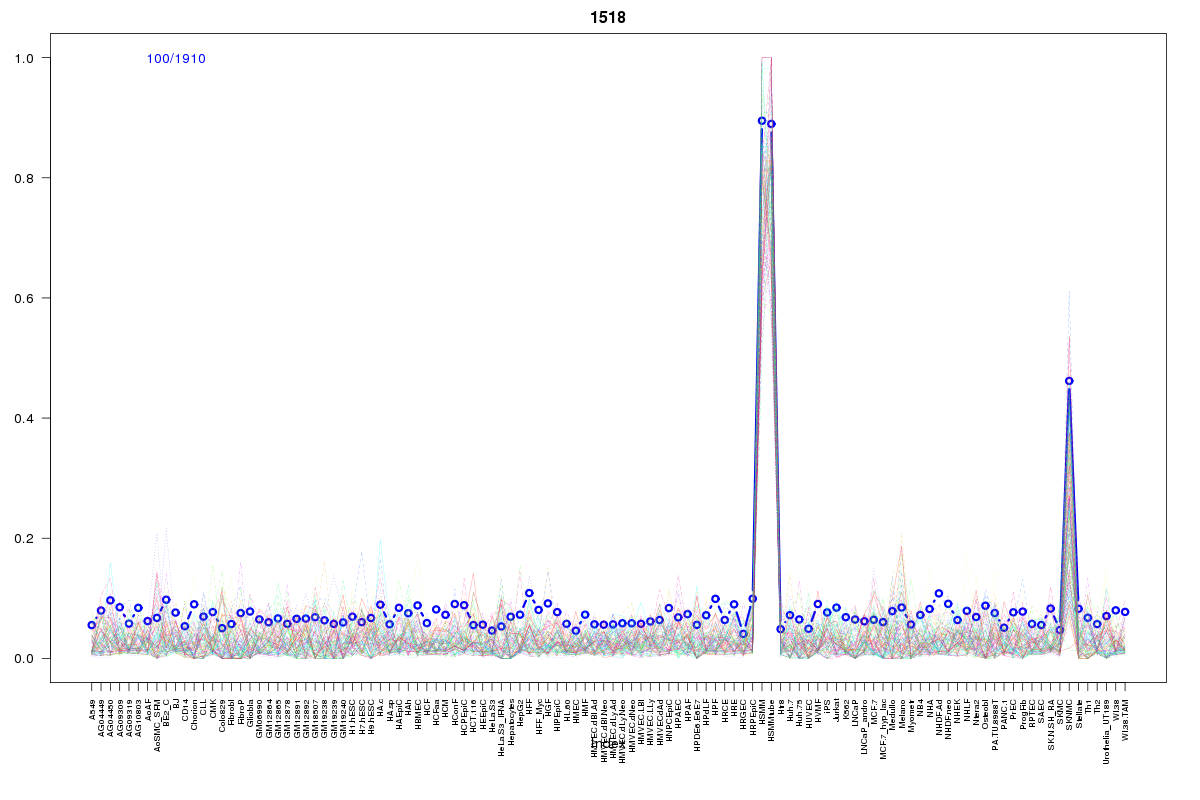 | 1518 | 1 |
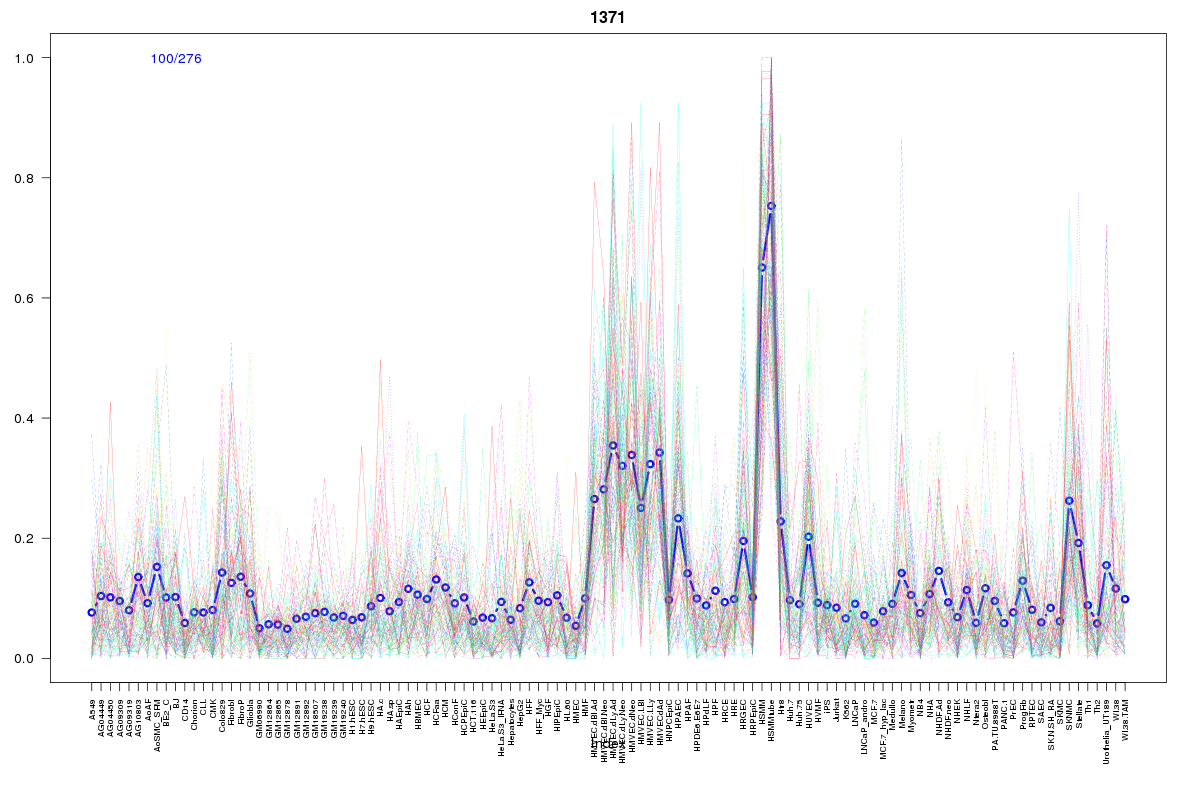 | 1371 | 1 |
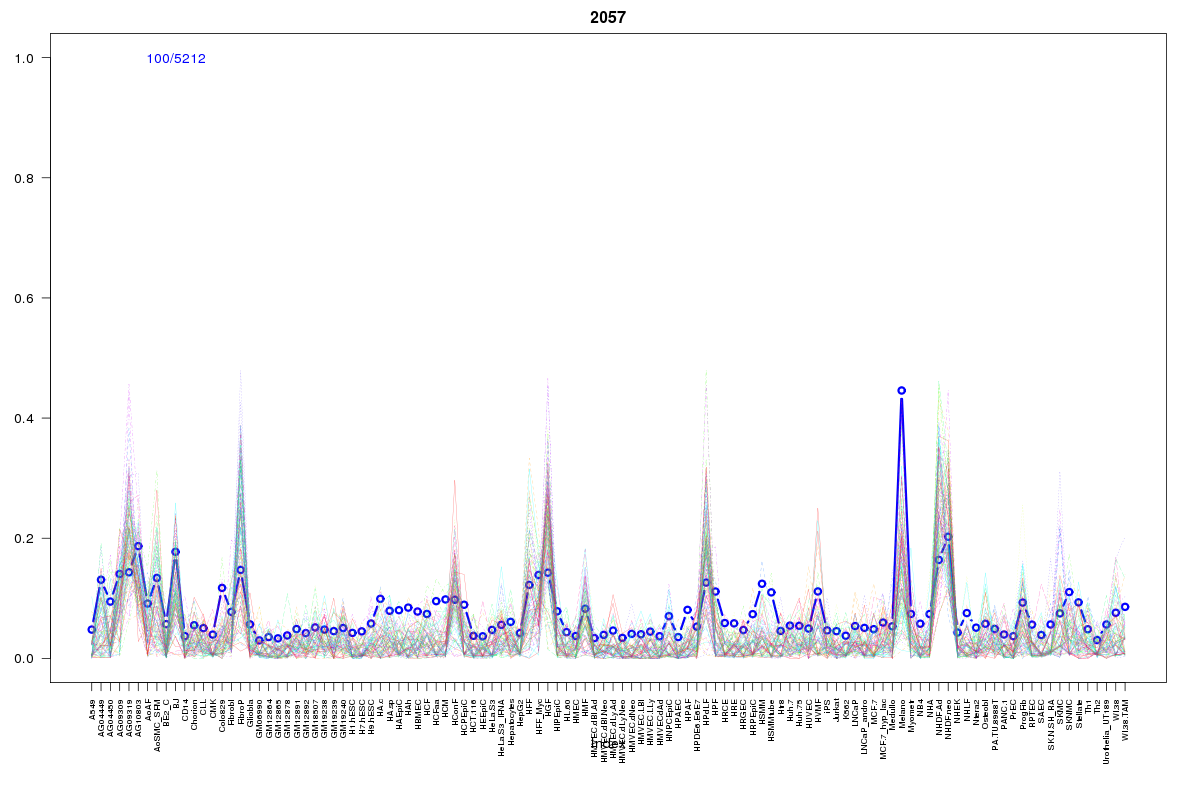 | 2057 | 1 |
 | 860 | 1 |
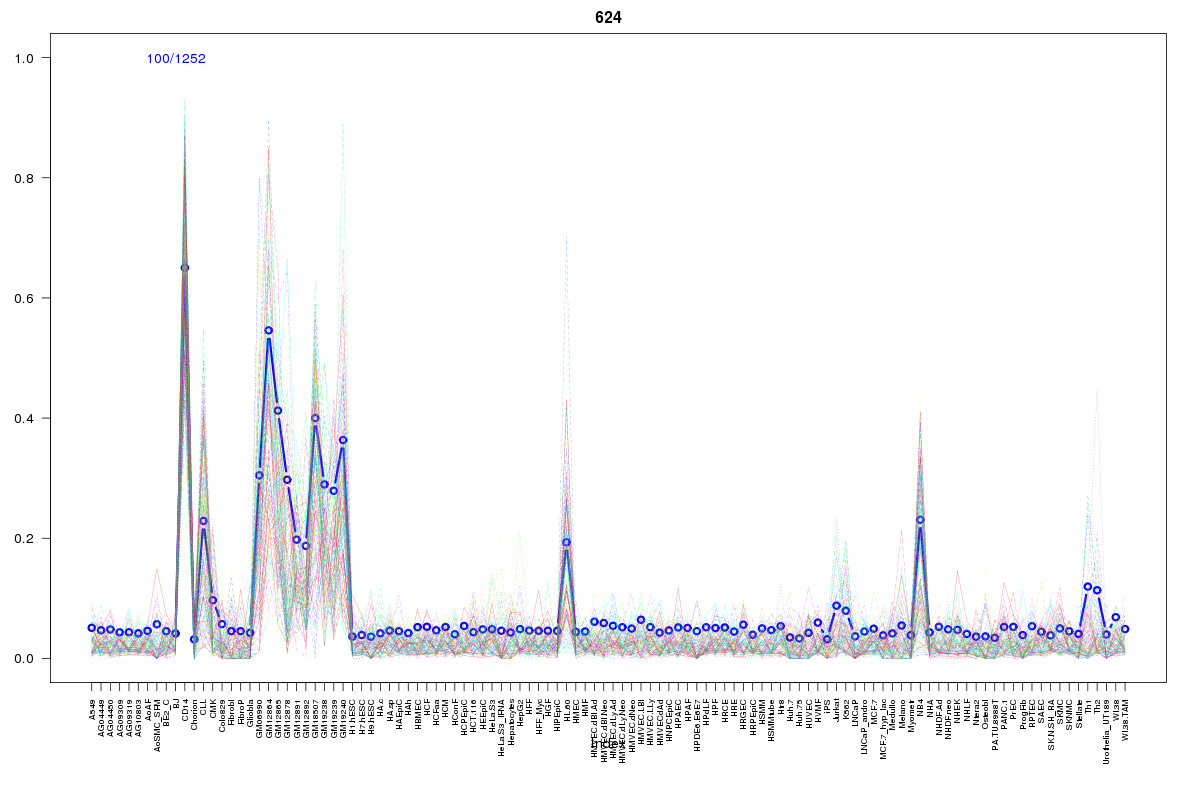 | 624 | 1 |
 | 527 | 1 |
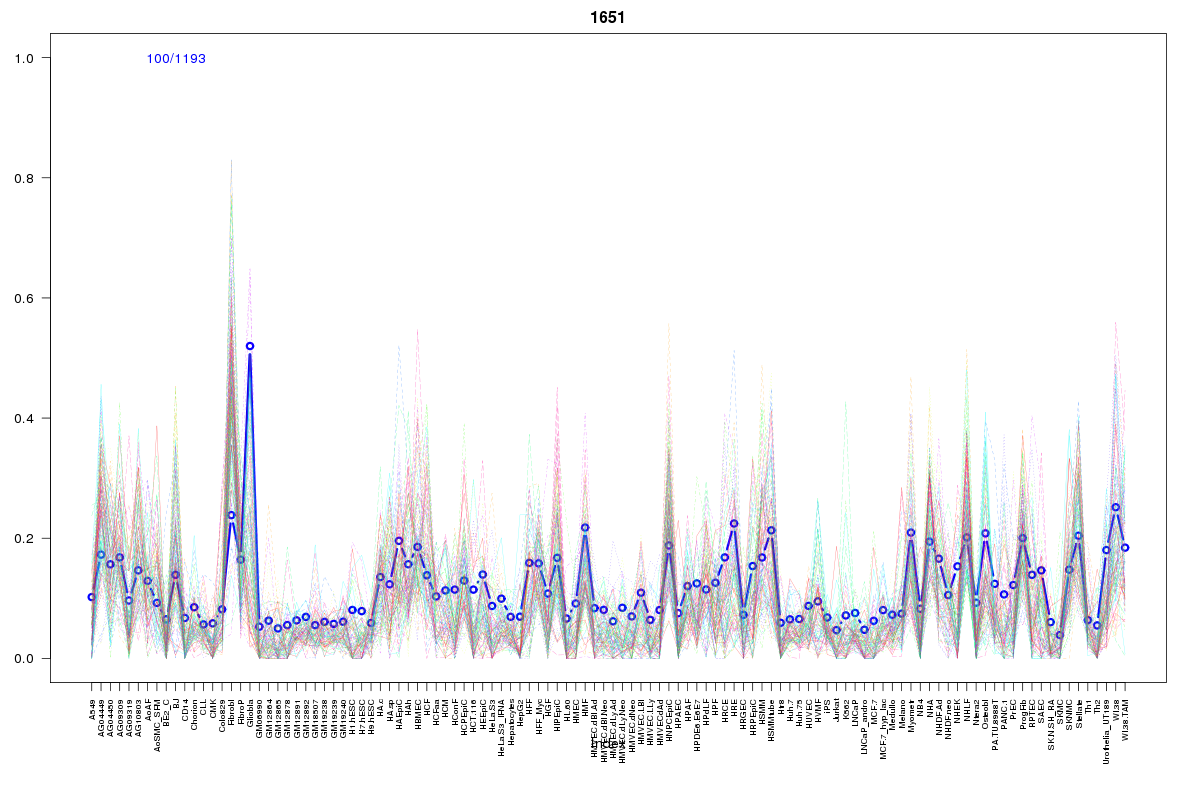 | 1651 | 1 |
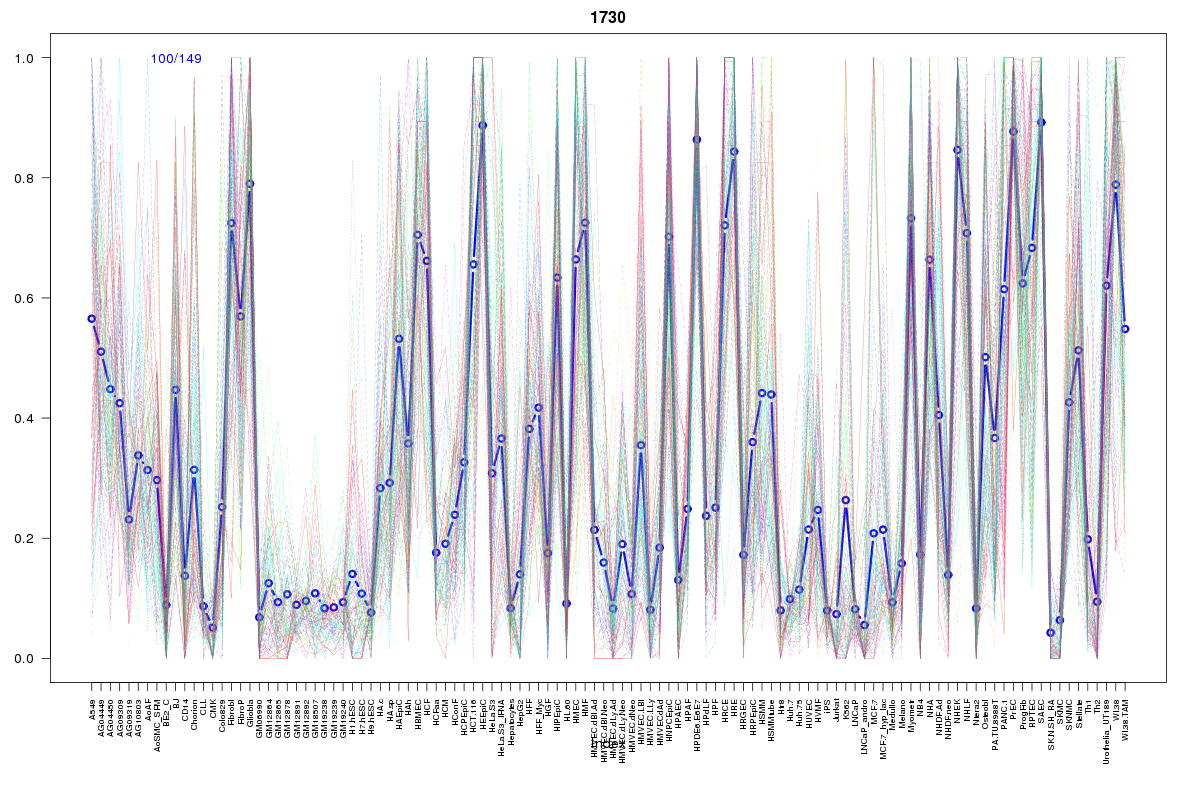 | 1730 | 1 |
Resources
BED file downloads
Connects to 21 DHS sitesTop 10 Correlated DHS Sites
p-values indiciate significant higher or lower correlation| Location | Cluster | P-value |
|---|---|---|
| chr12:57658740-57658890 | 1569 | 0 |
| chr12:57656320-57656470 | 1569 | 0 |
| chr12:57644920-57645070 | 1520 | 0 |
| chr12:57644465-57644615 | 1569 | 0.001 |
| chr12:57654285-57654435 | 1721 | 0.001 |
| chr12:57659440-57659590 | 1518 | 0.004 |
| chr12:57605140-57605290 | 1520 | 0.006 |
| chr12:57666700-57666850 | 1371 | 0.007 |
| chr12:57602200-57602350 | 1569 | 0.011 |
| chr12:57605700-57605850 | 1522 | 0.014 |
| chr12:57642740-57642890 | 664 | 0.014 |
External Databases
UCSCEnsembl (ENSG00000185482)