SOM cluster: 1371
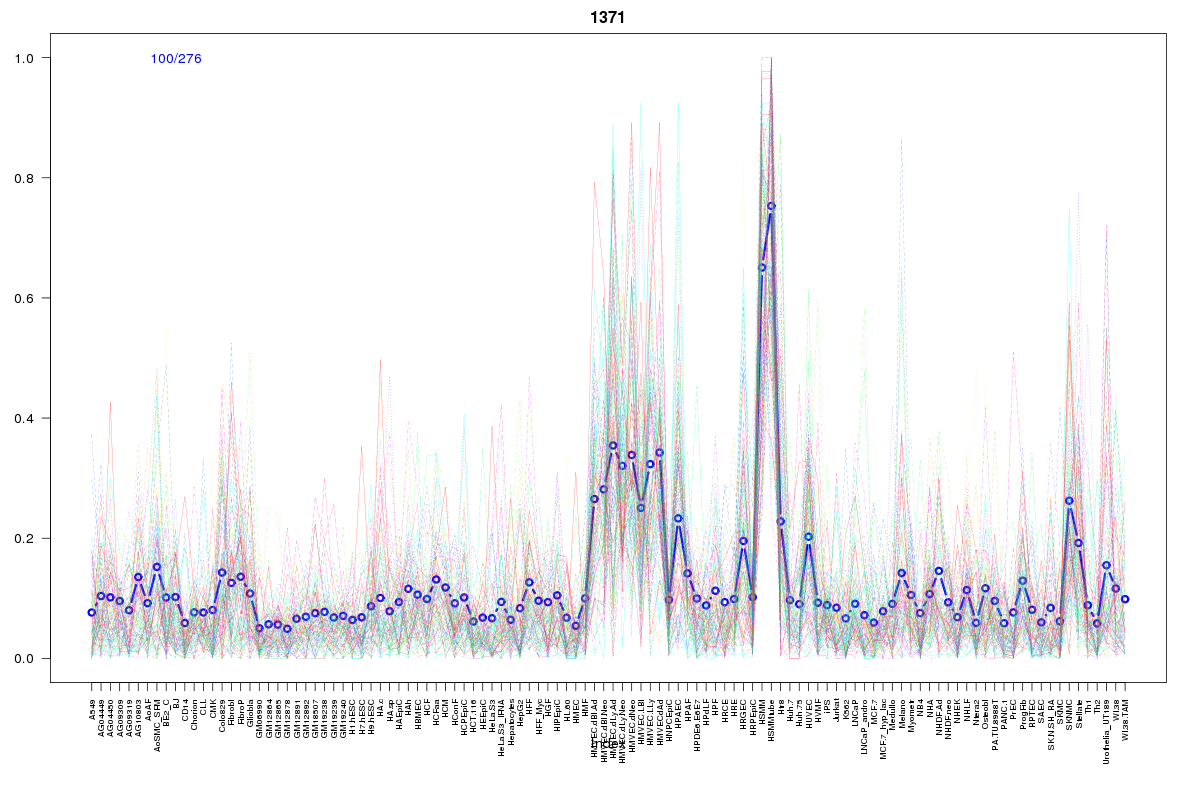
Cluster Hypersensitivity Profile

Genomic Location Trend
These plots show the distribution of the DHS sites surrounding the Transcript Start Site of the nearest gene.
Stats
Number of sites: 276Promoter: 1%
CpG-Island: 0%
Conserved: 47%
Enriched Motifs & Matches
Match Detail: [Jaspar]
|
| ||
|---|---|---|
| Sites: 50/100 | e-val: 1.2e-27 | ||
| Factor | e-val(match) | DB |
| Myf | 0.00000011578 | JASPAR |
| TAL1::TCF3 | 0.000018722 | JASPAR |
| NHLH1 | 0.000031263 | JASPAR |
| Myb | 0.000086585 | JASPAR |
| REST | 0.0011215 | JASPAR |
BED file downloads
Top 10 Example Regions
| Location | Gene Link | Dist. |
|---|---|---|
| chr2: 109196040-109196190 | AC010095.5 | 40.77 |
| chr2: 109196040-109196190 | LIMS1 | 40.77 |
| chr1: 208385320-208385470 | PLXNA2 | 45.7 |
| chr1: 208062005-208062155 | CD34 | 47.01 |
| chr17: 76223740-76223890 | TK1 | 50.58 |
| chr3: 133723840-133723990 | SLCO2A1 | 51.94 |
| chr5: 148830600-148830750 | MIR143 | 57.12 |
| chr5: 148830600-148830750 | RPL29P14 | 57.12 |
| chr16: 68928400-68928550 | TANGO6 | 64.99 |
| chr1: 22260580-22260730 | HSPG2 | 66.55 |