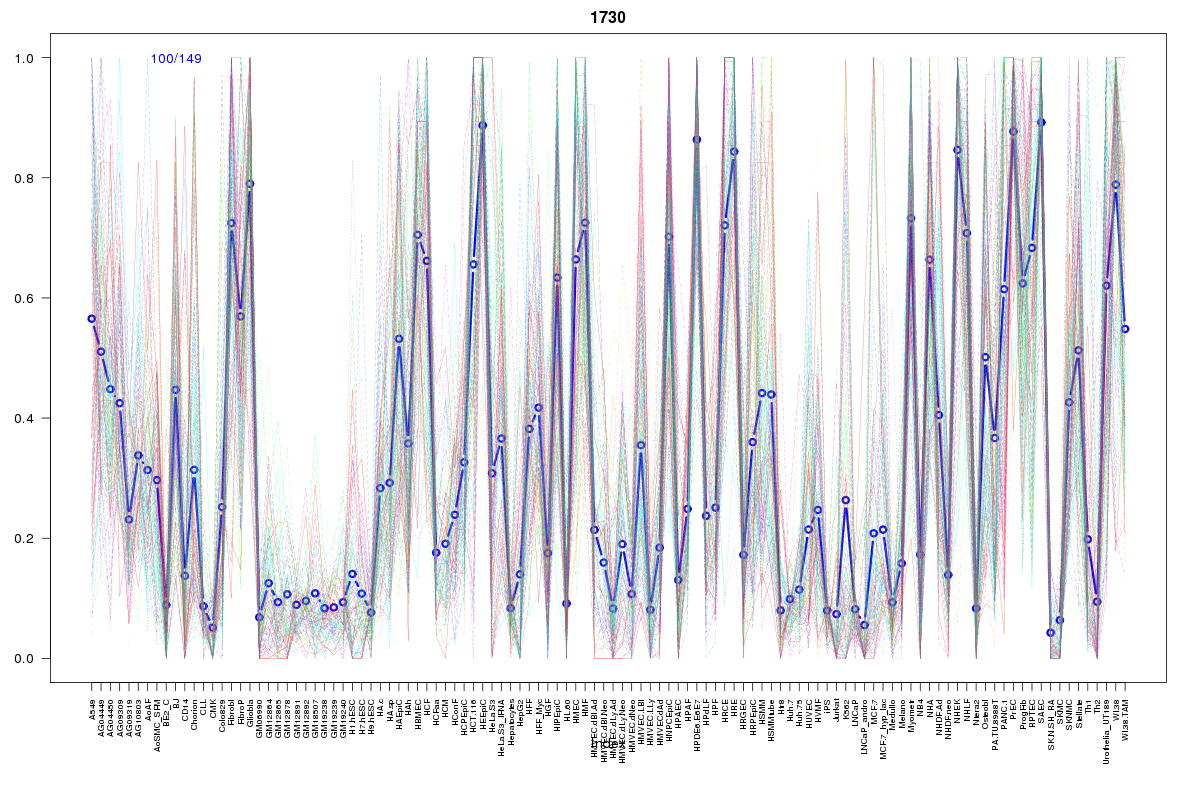
SOM cluster: 1730
Cluster Hypersensitivity Profile

Genomic Location Trend
These plots show the distribution of the DHS sites surrounding the Transcript Start Site of the nearest gene.
Stats
Number of sites: 149Promoter: 4%
CpG-Island: 0%
Conserved: 32%
Enriched Motifs & Matches
Match Detail: [Jaspar]
|
| ||
|---|---|---|
| Sites: 60/100 | e-val: 5.3e-37 | ||
| Factor | e-val(match) | DB |
| AP1 | 0.0000000030397 | JASPAR |
| NFE2L2 | 0.0000000030483 | JASPAR |
| PPARG | 0.0020052 | JASPAR |
| Pax2 | 0.0028585 | JASPAR |
| NFE2L1::MafG | 0.0067208 | JASPAR |
BED file downloads
Top 10 Example Regions
| Location | Gene Link | Dist. |
|---|---|---|
| chr8: 124161400-124161550 | HMGB1P19 | 37.99 |
| chr8: 124161400-124161550 | FAM83A-AS1 | 37.99 |
| chr5: 72836140-72836290 | AC099522.1 | 48.27 |
| chr5: 72836140-72836290 | ARHGEF28 | 48.27 |
| chr5: 72836140-72836290 | BTF3 | 48.27 |
| chr5: 72836140-72836290 | FOXD1 | 48.27 |
| chr5: 72836140-72836290 | ANKRA2 | 48.27 |
| chr17: 58450620-58450770 | APPBP2 | 50.83 |
| chr5: 149218860-149219010 | AC008427.2 | 53.48 |
| chr2: 108978980-108979130 | GCC2 | 55.75 |