SOM cluster: 624
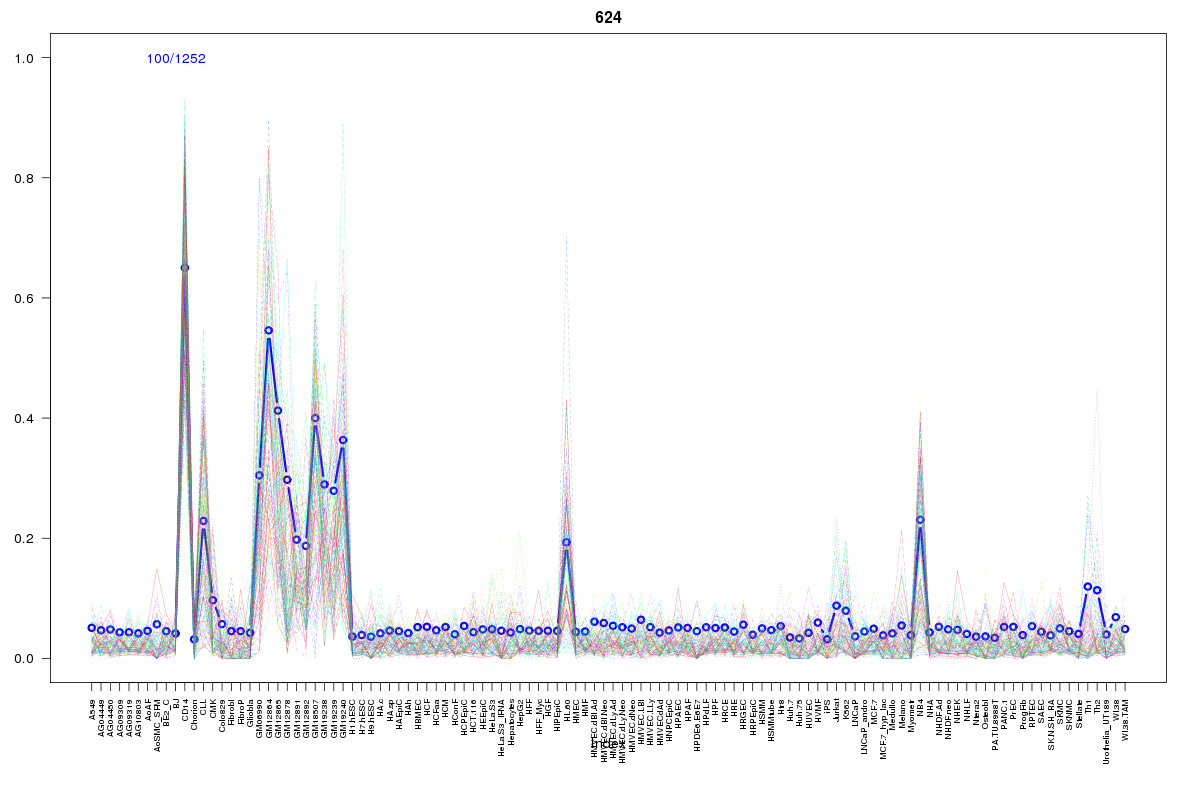
Cluster Hypersensitivity Profile

Genomic Location Trend
These plots show the distribution of the DHS sites surrounding the Transcript Start Site of the nearest gene.
Stats
Number of sites: 1252Promoter: 2%
CpG-Island: 0%
Conserved: 26%
Enriched Motifs & Matches
Match Detail: [Jaspar]
|
| ||
|---|---|---|
| Sites: 36/100 | e-val: 2.4e-36 | ||
| Factor | e-val(match) | DB |
| SPI1 | 0.000000043556 | JASPAR |
| SPIB | 0.0000017239 | JASPAR |
| FEV | 0.000033712 | JASPAR |
| ELF5 | 0.00030266 | JASPAR |
| IRF1 | 0.0014995 | JASPAR |
BED file downloads
Top 10 Example Regions
| Location | Gene Link | Dist. |
|---|---|---|
| chr7: 36782600-36782750 | AOAH | 40.15 |
| chr2: 54865360-54865510 | AC093110.3 | 42.81 |
| chr7: 77095880-77096030 | GSAP | 44.22 |
| chr1: 156125660-156125810 | SEMA4A | 45.46 |
| chr8: 49430580-49430730 | RP11-567J20.2 | 48.09 |
| chr8: 49430580-49430730 | RP11-567J20.3 | 48.09 |
| chr18: 67625700-67625850 | CD226 | 49.38 |
| chr4: 40650765-40650915 | RBM47 | 49.42 |
| chr12: 221040-221190 | RP11-598F7.6 | 51.04 |
| chrX: 129225720-129225870 | ELF4 | 51.68 |