Gene: TRAK1
chr3: 42055293-42267381Expression Profile
(log scale)
Graphical Connections
Distribution of linked clusters:
You may find it interesting if many of the connected DHS sites belong to the same cluster.| Cluster Profile | Cluster ID | Number of DHS sites in this cluster |
|---|---|---|
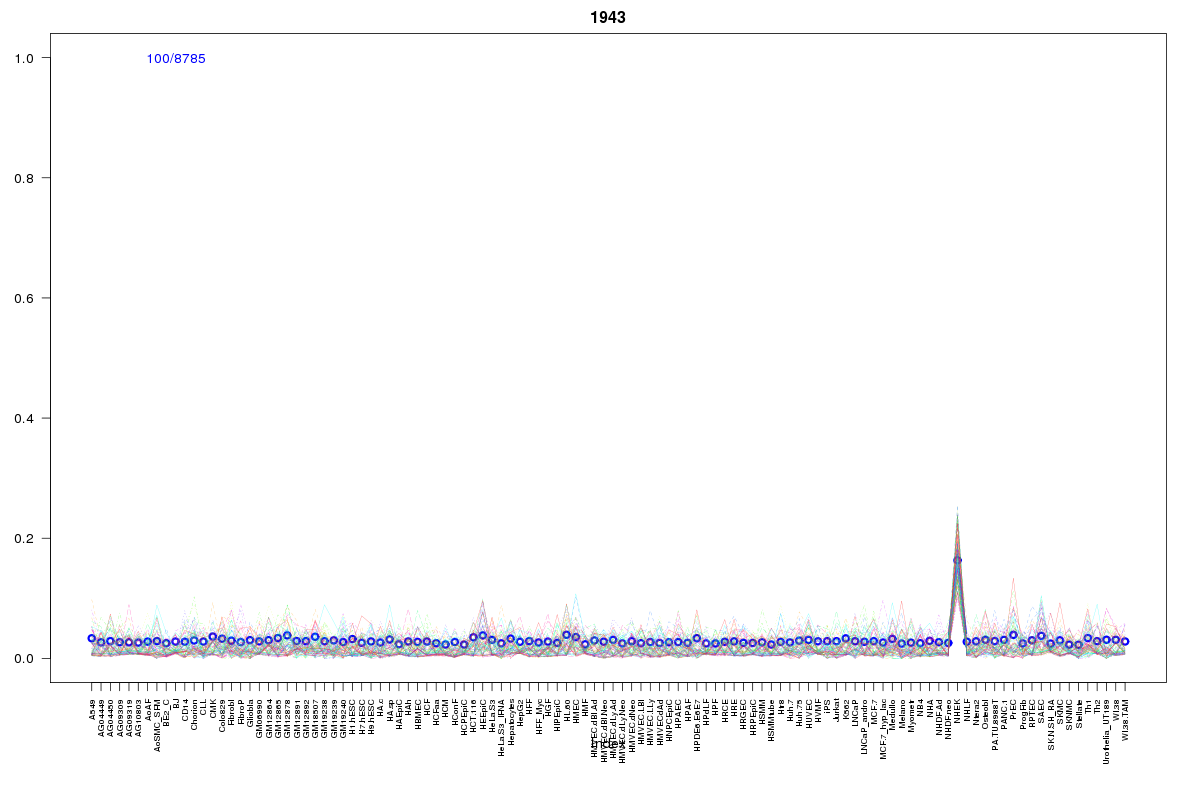 | 1943 | 6 |
 | 739 | 4 |
 | 687 | 3 |
 | 934 | 2 |
 | 1605 | 2 |
 | 568 | 1 |
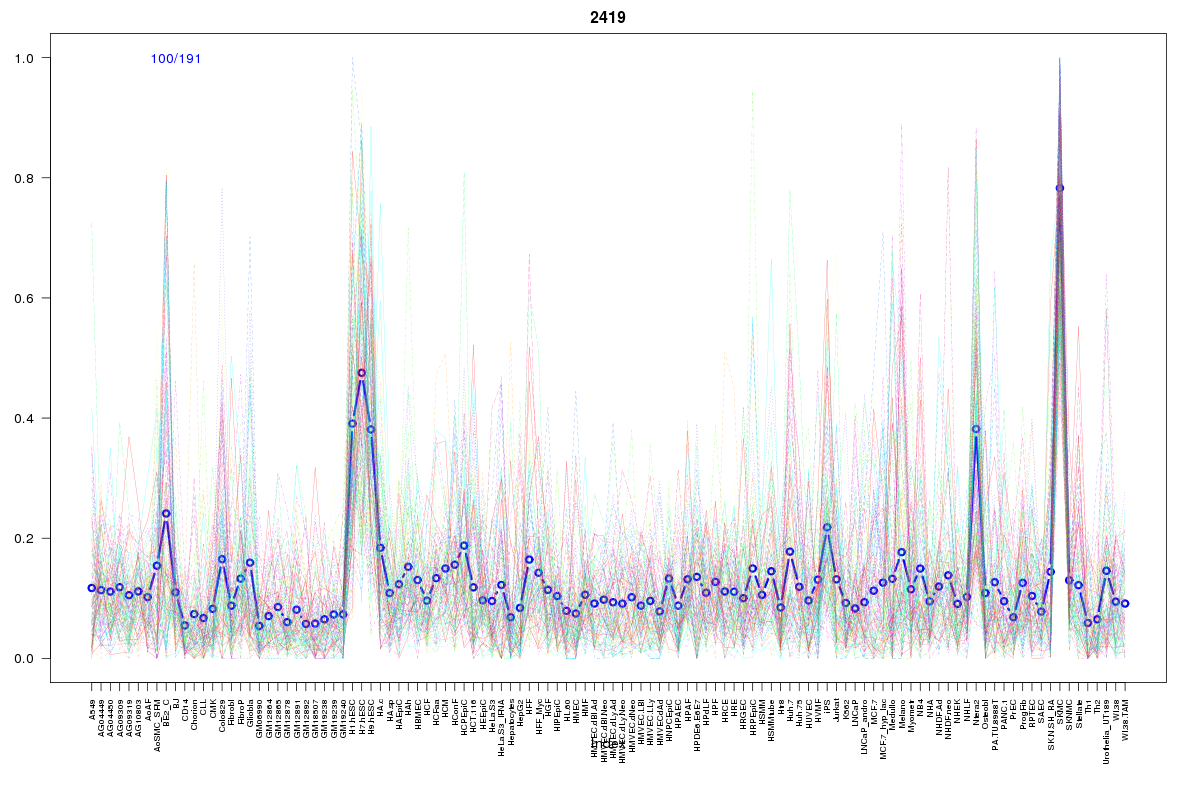 | 2419 | 1 |
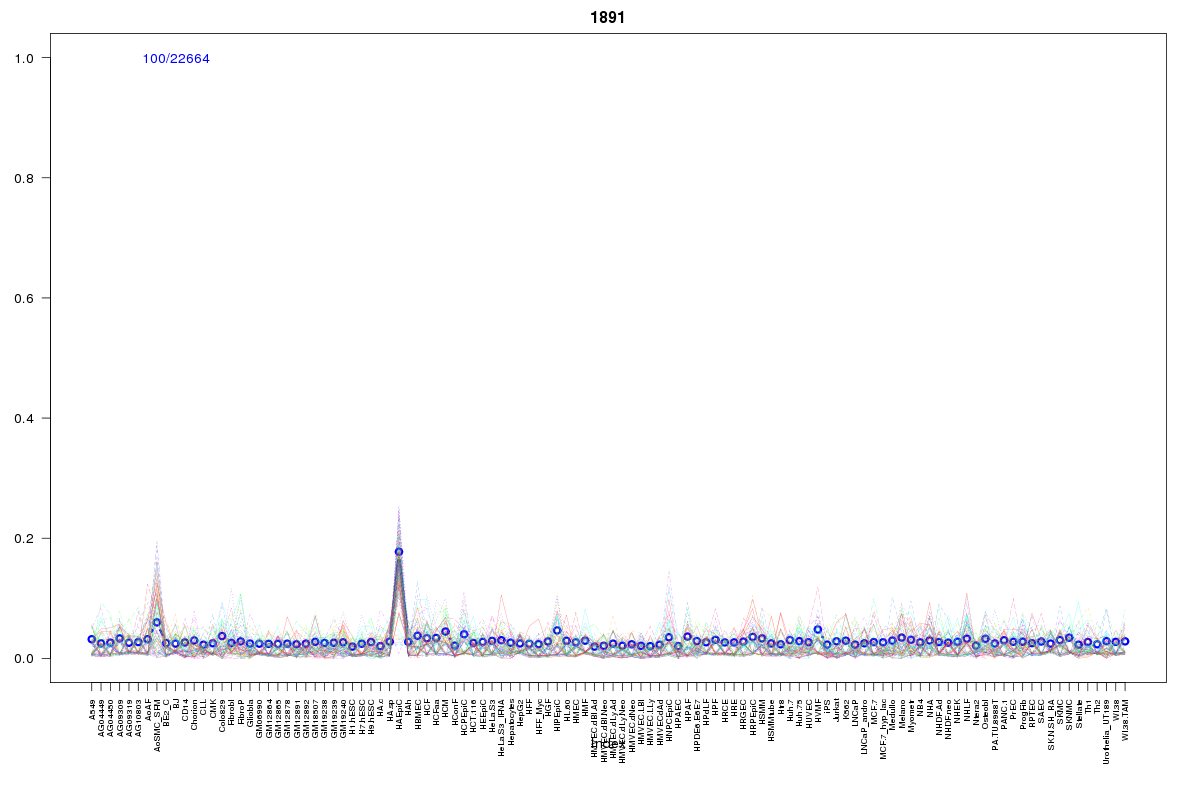 | 1891 | 1 |
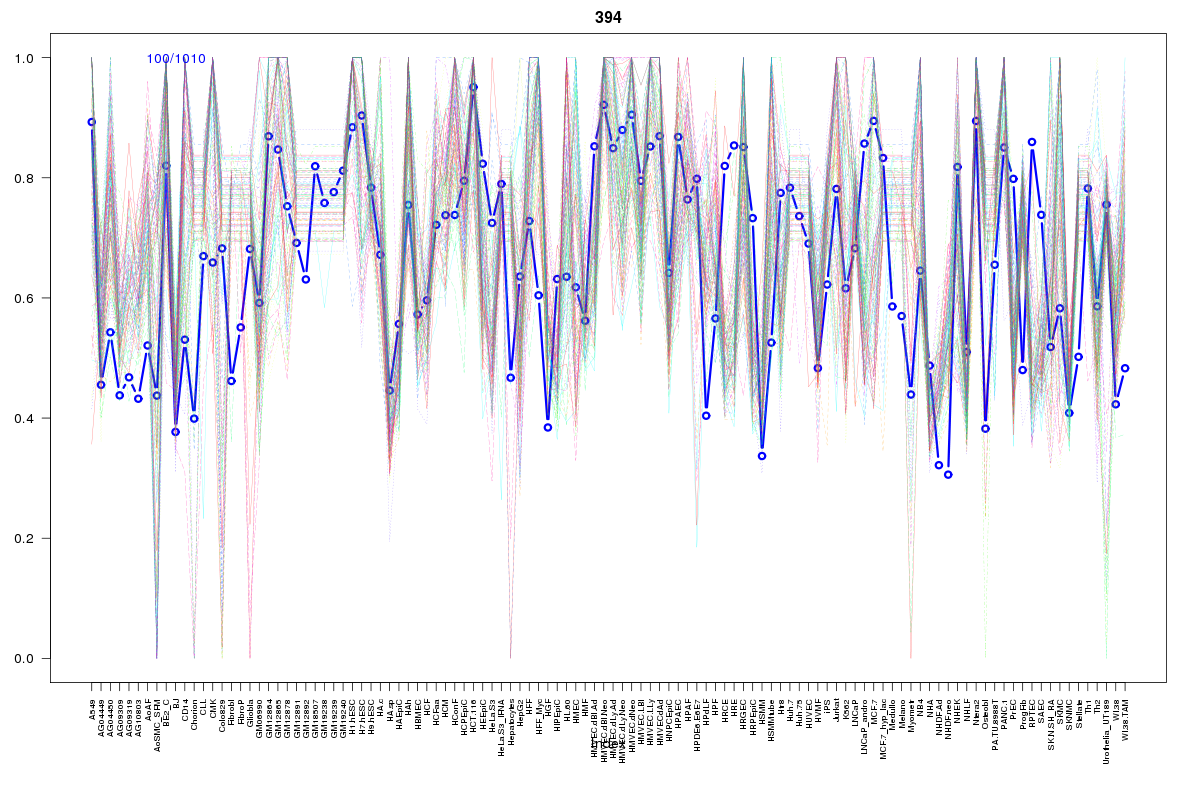 | 394 | 1 |
 | 979 | 1 |
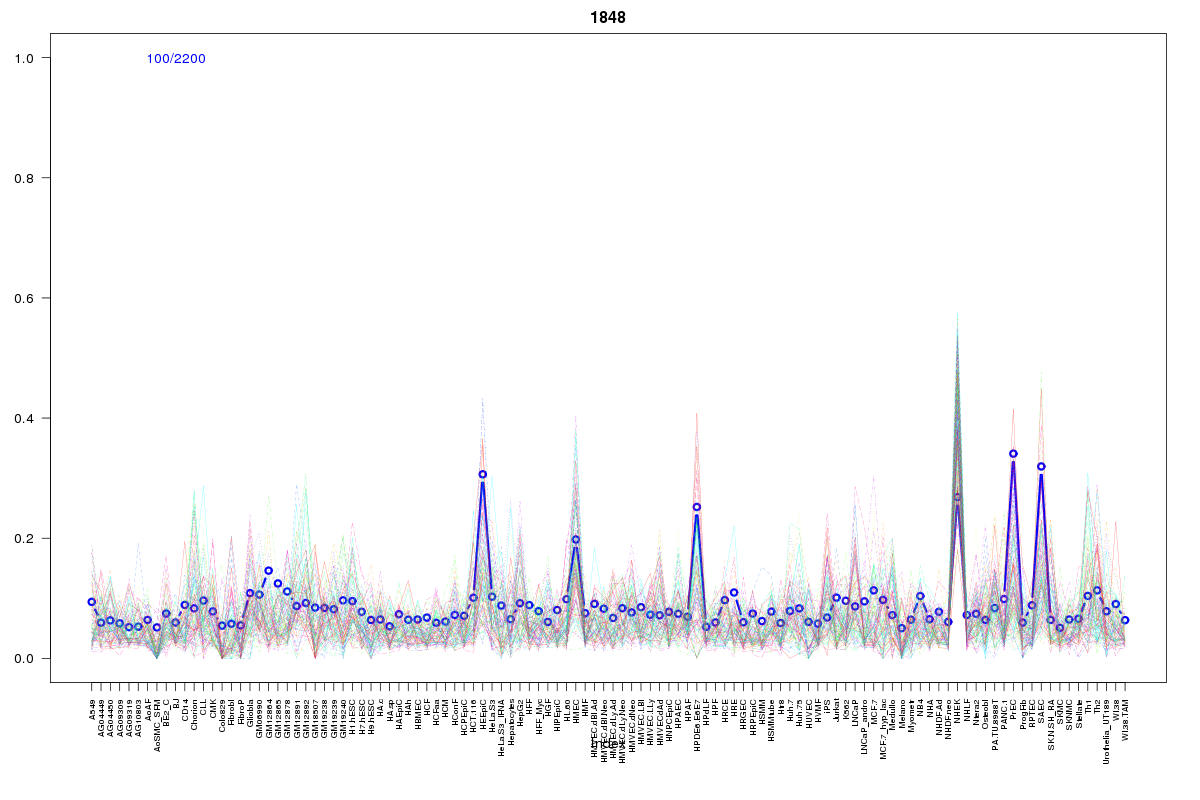 | 1848 | 1 |
 | 2055 | 1 |
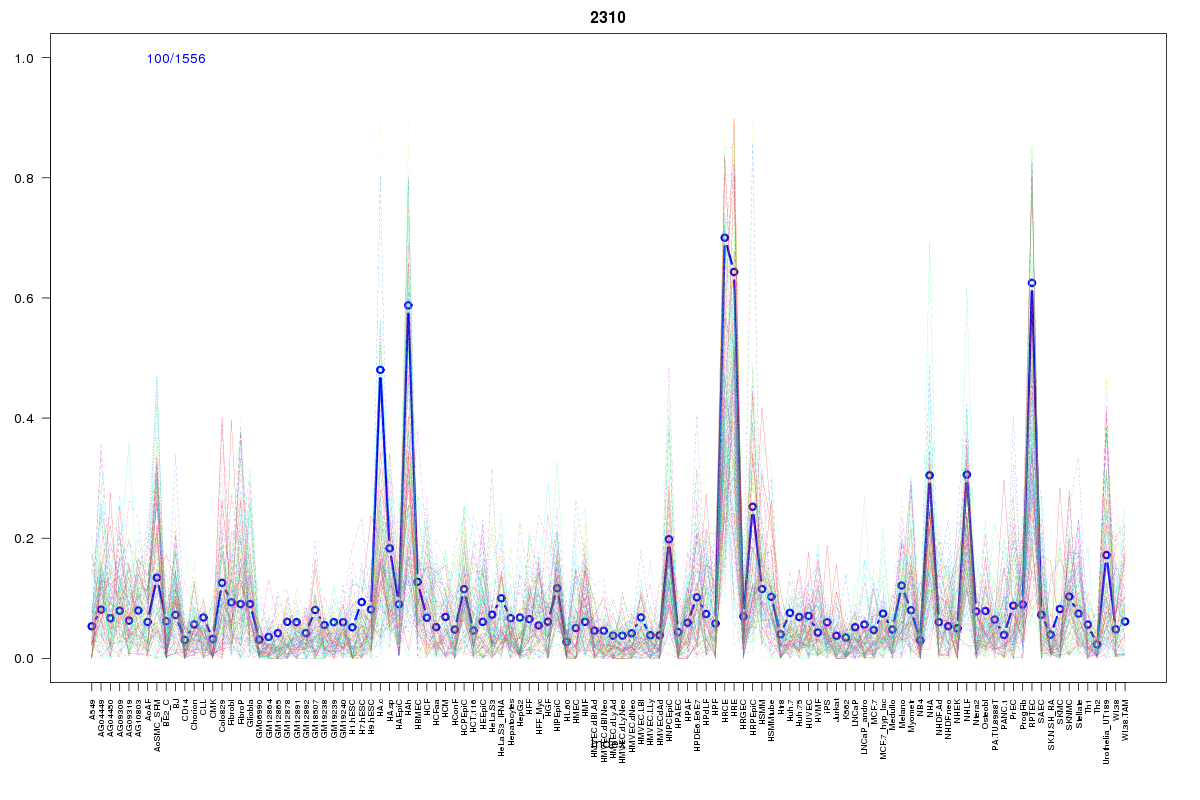 | 2310 | 1 |
 | 935 | 1 |
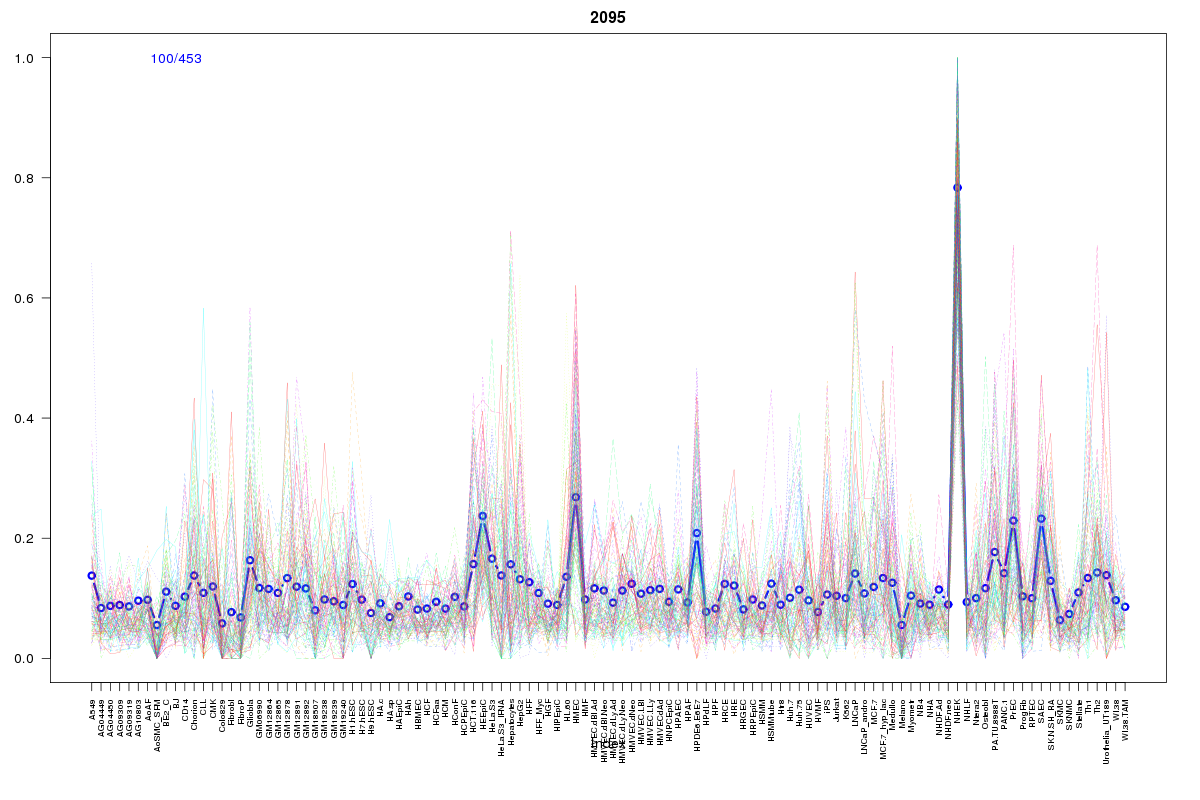 | 2095 | 1 |
 | 608 | 1 |
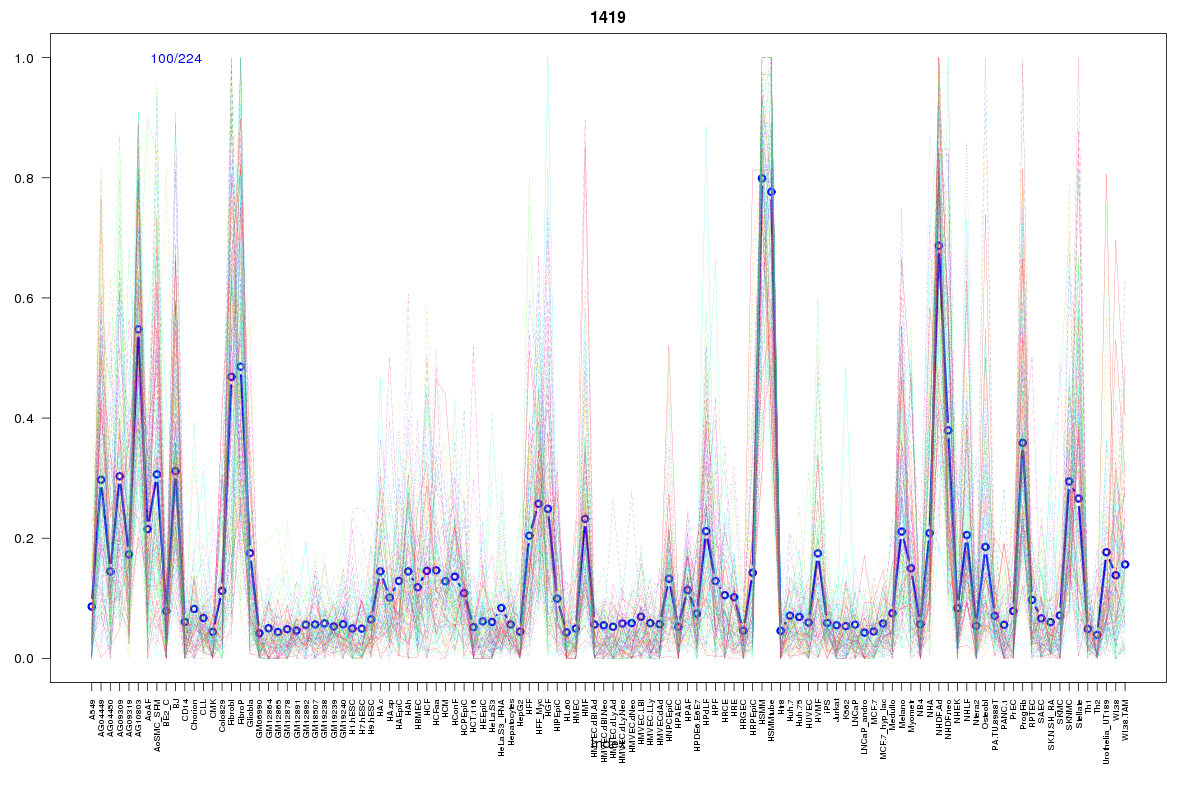 | 1419 | 1 |
 | 2211 | 1 |
 | 2023 | 1 |
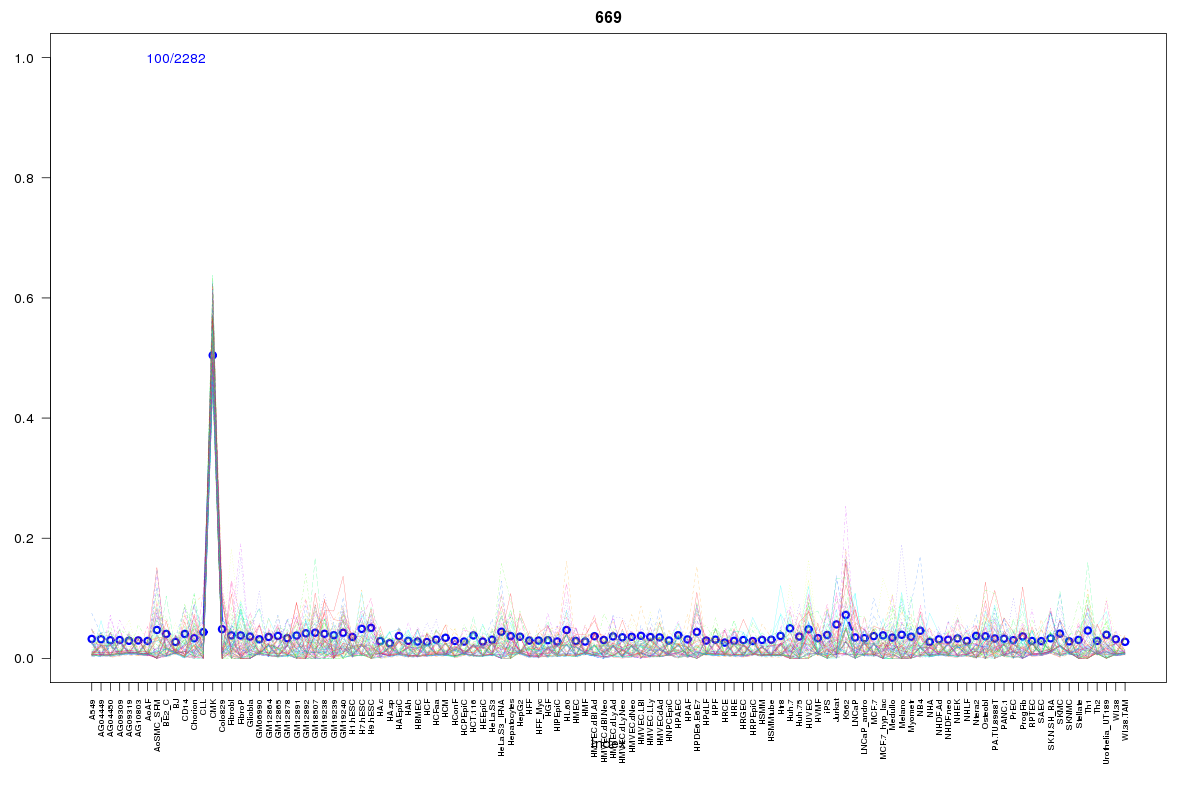 | 669 | 1 |
Resources
BED file downloads
Connects to 32 DHS sitesTop 10 Correlated DHS Sites
p-values indiciate significant higher or lower correlation| Location | Cluster | P-value |
|---|---|---|
| chr3:42161140-42161290 | 739 | 0.002 |
| chr3:42140885-42141035 | 1605 | 0.002 |
| chr3:42162640-42162790 | 608 | 0.003 |
| chr3:42253705-42253855 | 1943 | 0.003 |
| chr3:42221400-42221550 | 1943 | 0.003 |
| chr3:42225800-42225950 | 739 | 0.003 |
| chr3:42148200-42148350 | 739 | 0.003 |
| chr3:42243200-42243350 | 687 | 0.003 |
| chr3:42225960-42226110 | 739 | 0.003 |
| chr3:42140225-42140375 | 1943 | 0.003 |
| chr3:42139760-42139910 | 934 | 0.003 |
External Databases
UCSCEnsembl (ENSG00000182606)