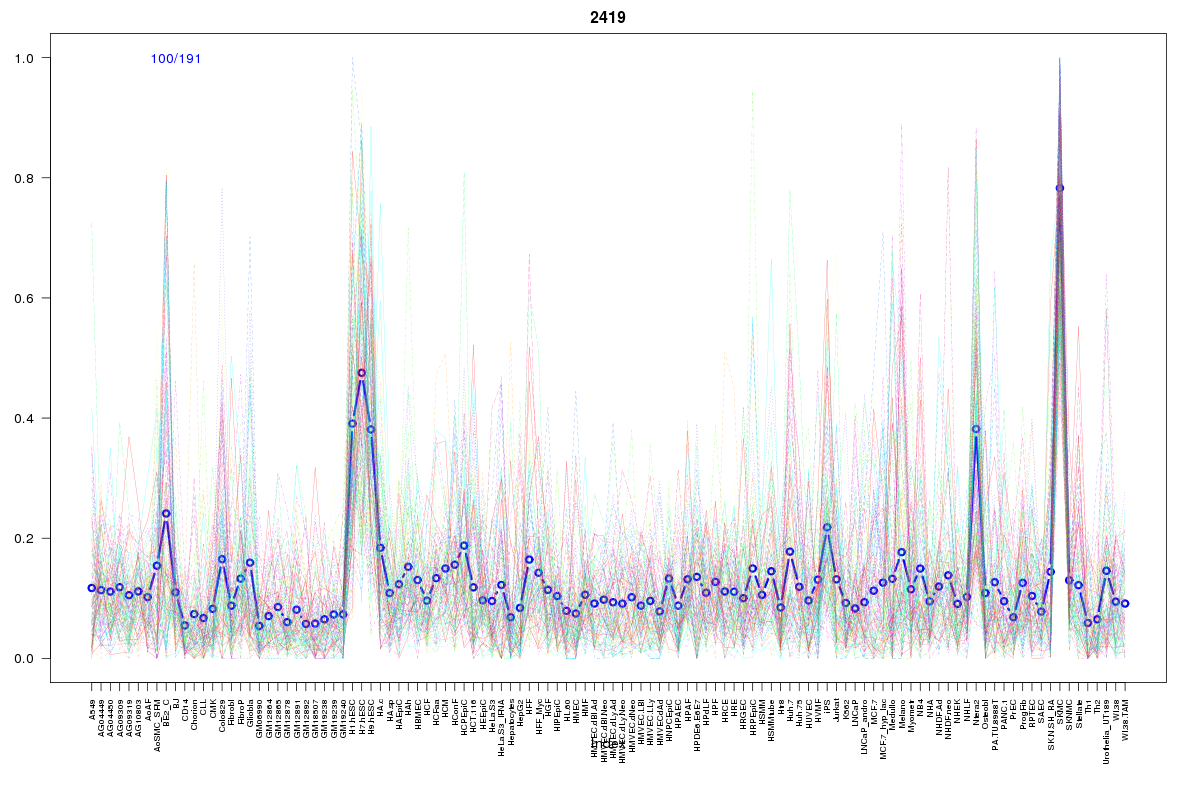
SOM cluster: 2419
Cluster Hypersensitivity Profile

Genomic Location Trend
These plots show the distribution of the DHS sites surrounding the Transcript Start Site of the nearest gene.
Stats
Number of sites: 191Promoter: 7%
CpG-Island: 7%
Conserved: 53%
Enriched Motifs & Matches
Match Detail: [Jaspar]
|
| ||
|---|---|---|
| Sites: 25/100 | e-val: 0.14 | ||
| Factor | e-val(match) | DB |
| EWSR1-FLI1 | 0.00000000019025 | JASPAR |
| SP1 | 0.0000040083 | JASPAR |
| FEV | 0.000096806 | JASPAR |
| SPI1 | 0.0012654 | JASPAR |
| Tal1::Gata1 | 0.006674 | JASPAR |
BED file downloads
Top 10 Example Regions
| Location | Gene Link | Dist. |
|---|---|---|
| chr13: 100623960-100624110 | ZIC2 | 39.46 |
| chr13: 100623960-100624110 | CLYBL | 39.46 |
| chr13: 100623960-100624110 | ZIC5 | 39.46 |
| chr8: 20126060-20126210 | LZTS1 | 55.2 |
| chr2: 127977885-127978035 | CYP27C1 | 60.48 |
| chr8: 37796360-37796510 | ADRB3 | 66.21 |
| chr2: 7259340-7259490 | RNF144A | 67.41 |
| chr2: 26136405-26136555 | AC010150.1 | 67.67 |
| chr3: 42306340-42306490 | CCK | 70.26 |
| chr3: 42306340-42306490 | TRAK1 | 70.26 |