SOM cluster: 394
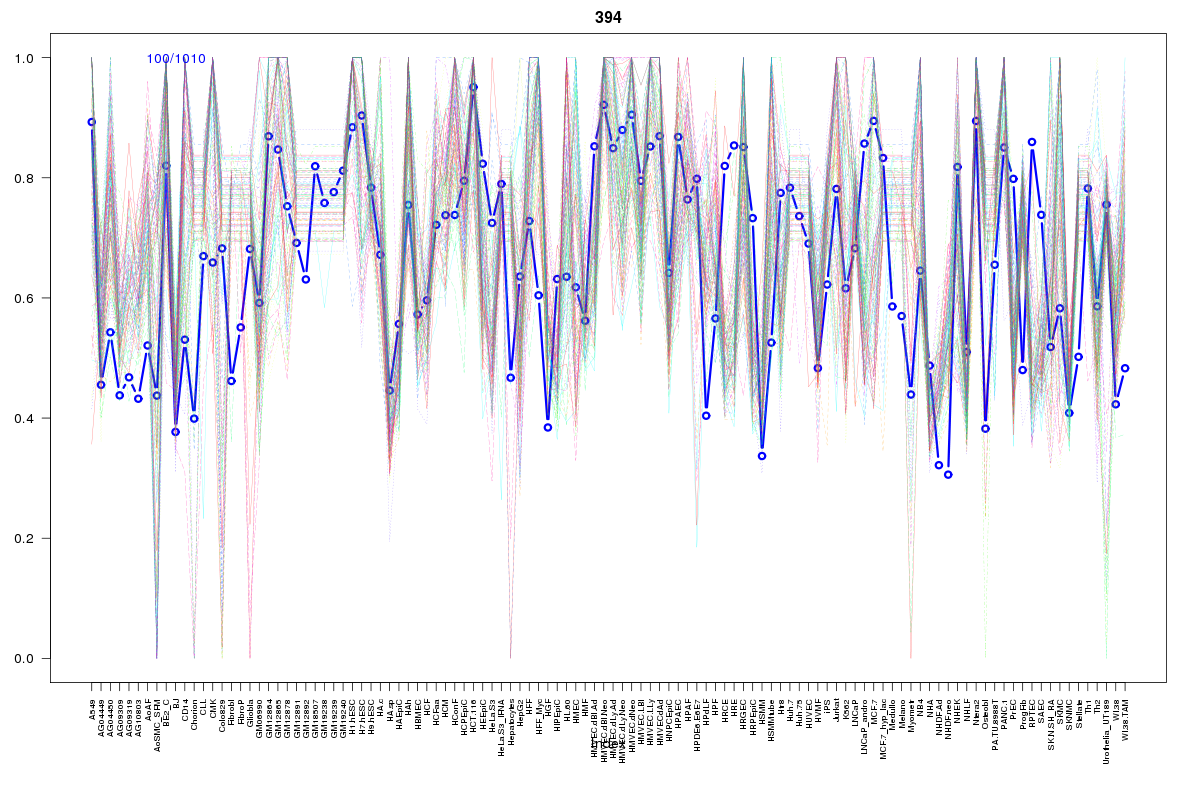
Cluster Hypersensitivity Profile

Genomic Location Trend
These plots show the distribution of the DHS sites surrounding the Transcript Start Site of the nearest gene.
Stats
Number of sites: 1010Promoter: 2%
CpG-Island: 1%
Conserved: 87%
Enriched Motifs & Matches
Match Detail: [Jaspar]
|
| ||
|---|---|---|
| Sites: 96/100 | e-val: 0 | ||
| Factor | e-val(match) | DB |
| CTCF | 1.1102e-16 | JASPAR |
| INSM1 | 0.0000039467 | JASPAR |
| Zfp423 | 0.0017866 | JASPAR |
| SP1 | 0.0054783 | JASPAR |
| PLAG1 | 0.0072435 | JASPAR |
|
| ||
| Sites: 98/100 | e-val: 0.0000099 | ||
| Factor | e-val(match) | DB |
| SP1 | 0.0000072317 | JASPAR |
| EBF1 | 0.0019324 | JASPAR |
| MZF1_1-4 | 0.0021058 | JASPAR |
| RXR::RAR_DR5 | 0.0055224 | JASPAR |
| ZNF354C | 0.017963 | JASPAR |
|
| ||
| Sites: 31/100 | e-val: 0.065 | ||
| Factor | e-val(match) | DB |
| Zfp423 | 0.004255 | JASPAR |
| PLAG1 | 0.0045351 | JASPAR |
| FEV | 0.01174 | JASPAR |
| EBF1 | 0.038399 | JASPAR |
| ZEB1 | 0.044334 | JASPAR |
BED file downloads
Top 10 Example Regions
| Location | Gene Link | Dist. |
|---|---|---|
| chr11: 63606000-63606150 | C11orf84 | 36.27 |
| chr11: 63606000-63606150 | C11orf95 | 36.27 |
| chr11: 63606000-63606150 | MARK2 | 36.27 |
| chr11: 63535005-63535155 | RP11-466C23.4 | 39.69 |
| chr14: 76027400-76027550 | TTLL5 | 42.67 |
| chr14: 76027400-76027550 | C14orf1 | 42.67 |
| chr8: 22225400-22225550 | SLC39A14 | 46.53 |
| chr7: 133812020-133812170 | EXOC4 | 47.67 |
| chr1: 161337660-161337810 | RRM2P2 | 47.9 |
| chr3: 185661420-185661570 | TRA2B | 48.93 |