Gene: ENTPD3
chr3: 40428646-40470110Expression Profile
(log scale)
Graphical Connections
Distribution of linked clusters:
You may find it interesting if many of the connected DHS sites belong to the same cluster.| Cluster Profile | Cluster ID | Number of DHS sites in this cluster |
|---|---|---|
 | 1605 | 7 |
 | 2100 | 4 |
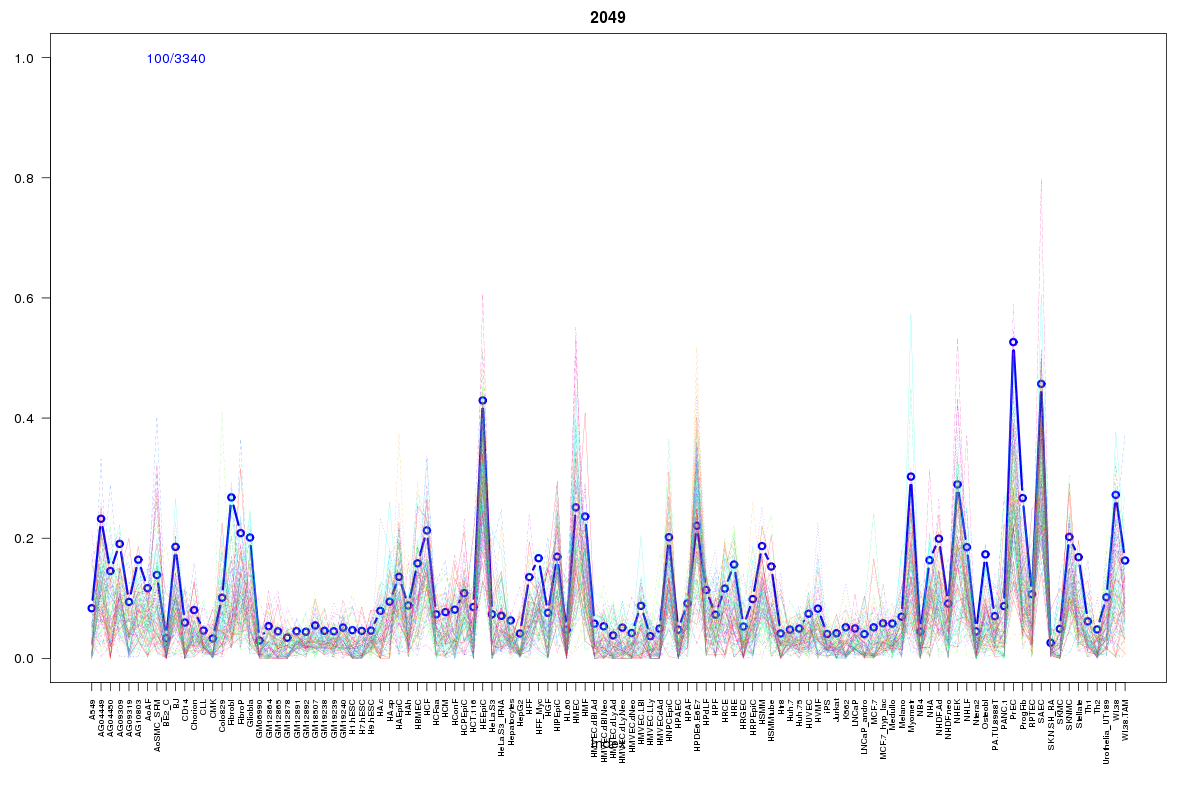 | 2049 | 2 |
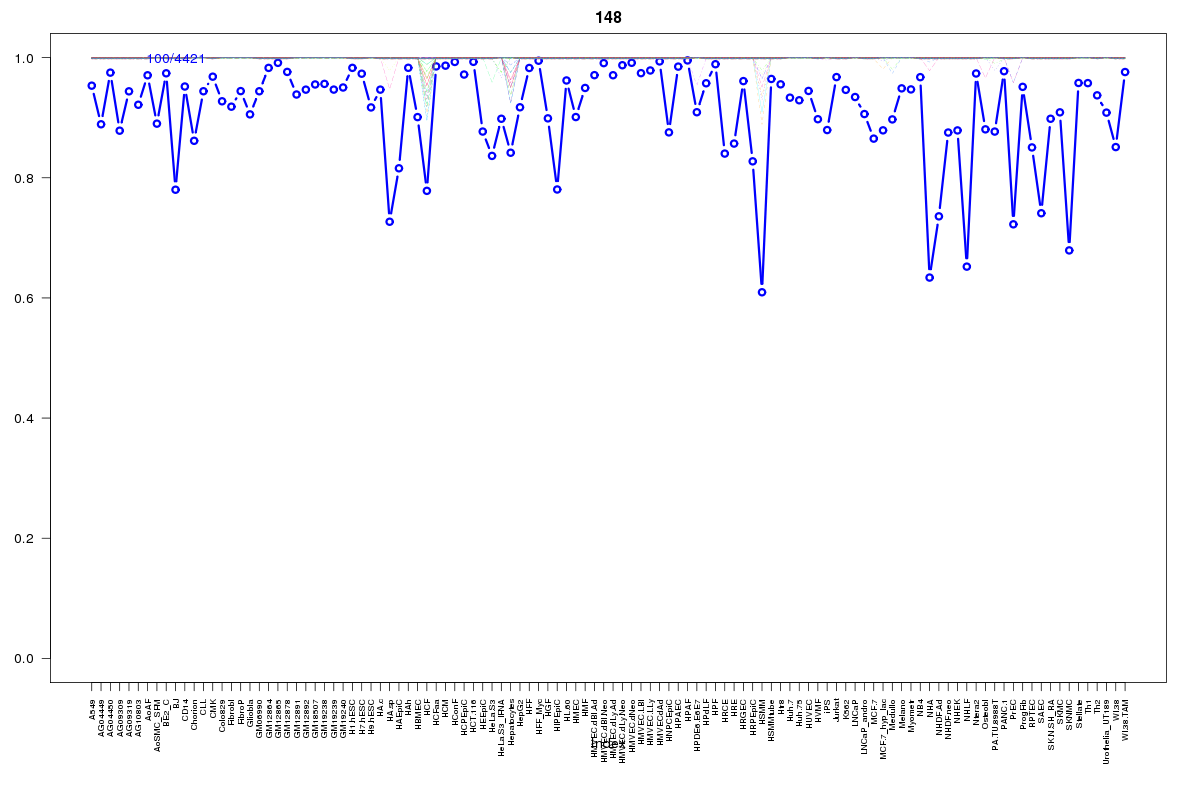 | 148 | 1 |
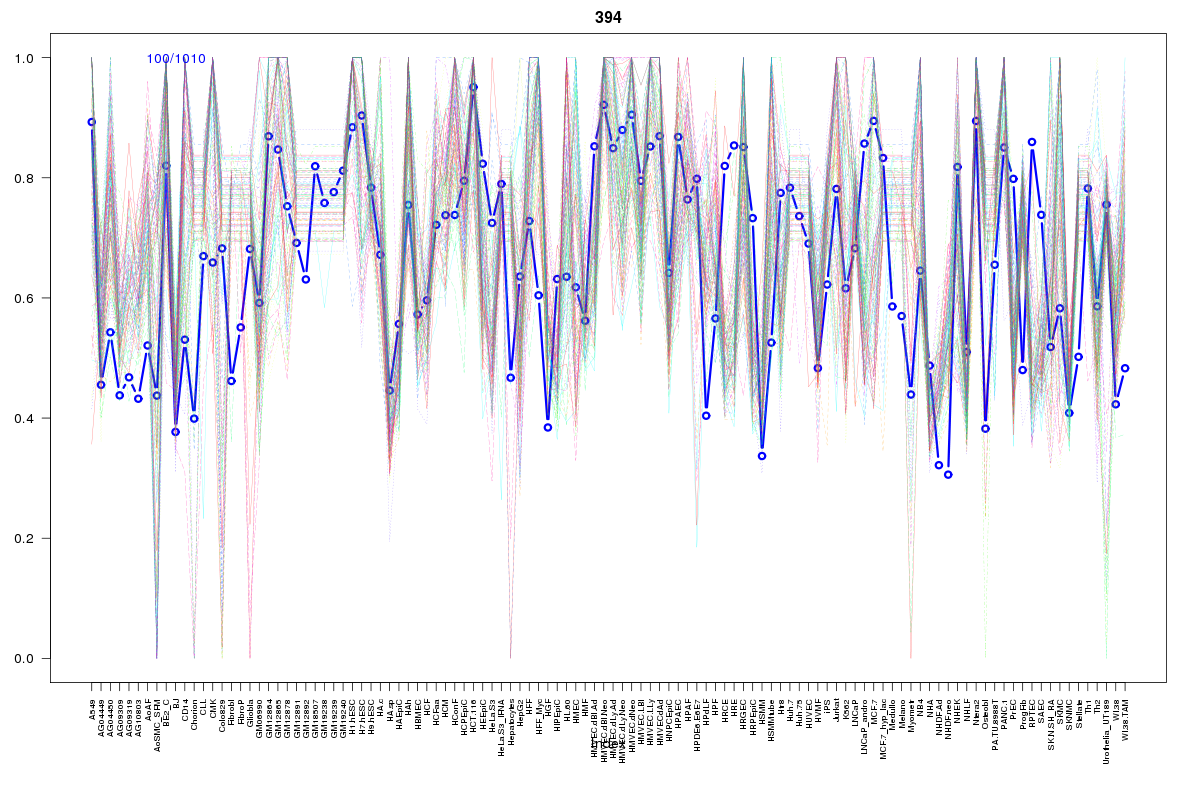 | 394 | 1 |
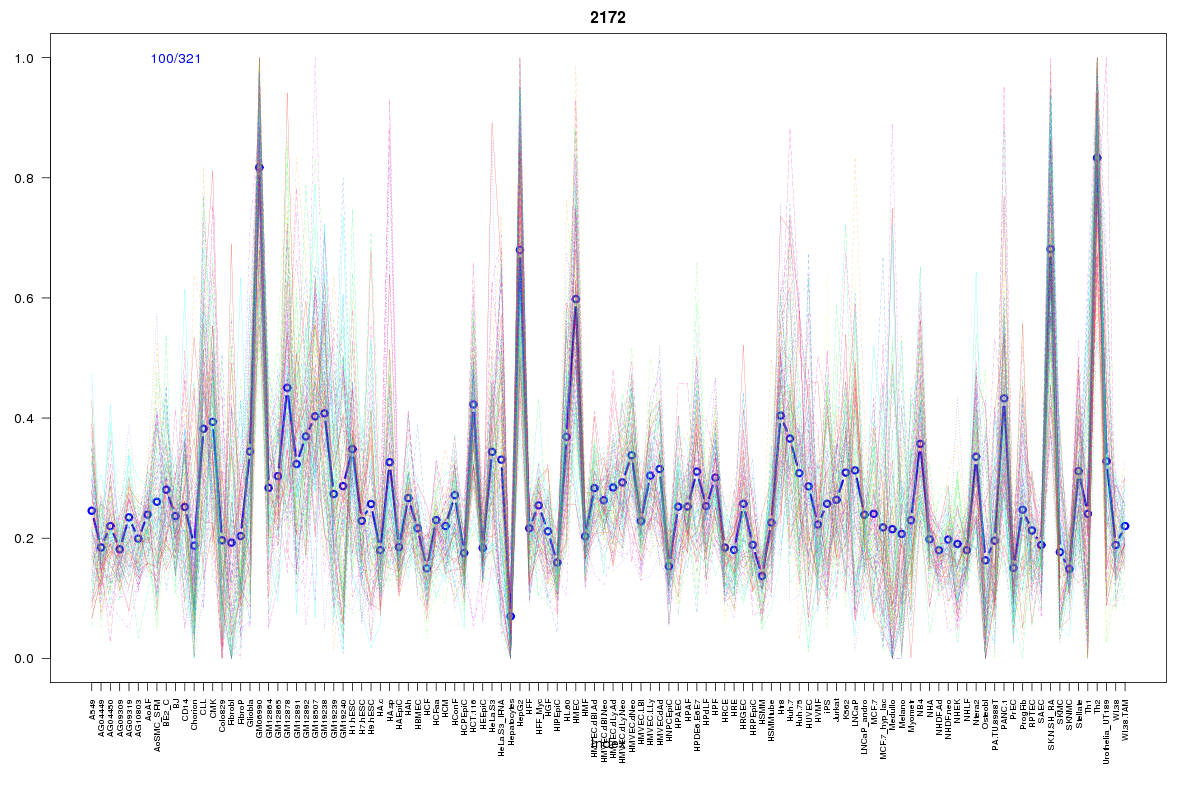 | 2172 | 1 |
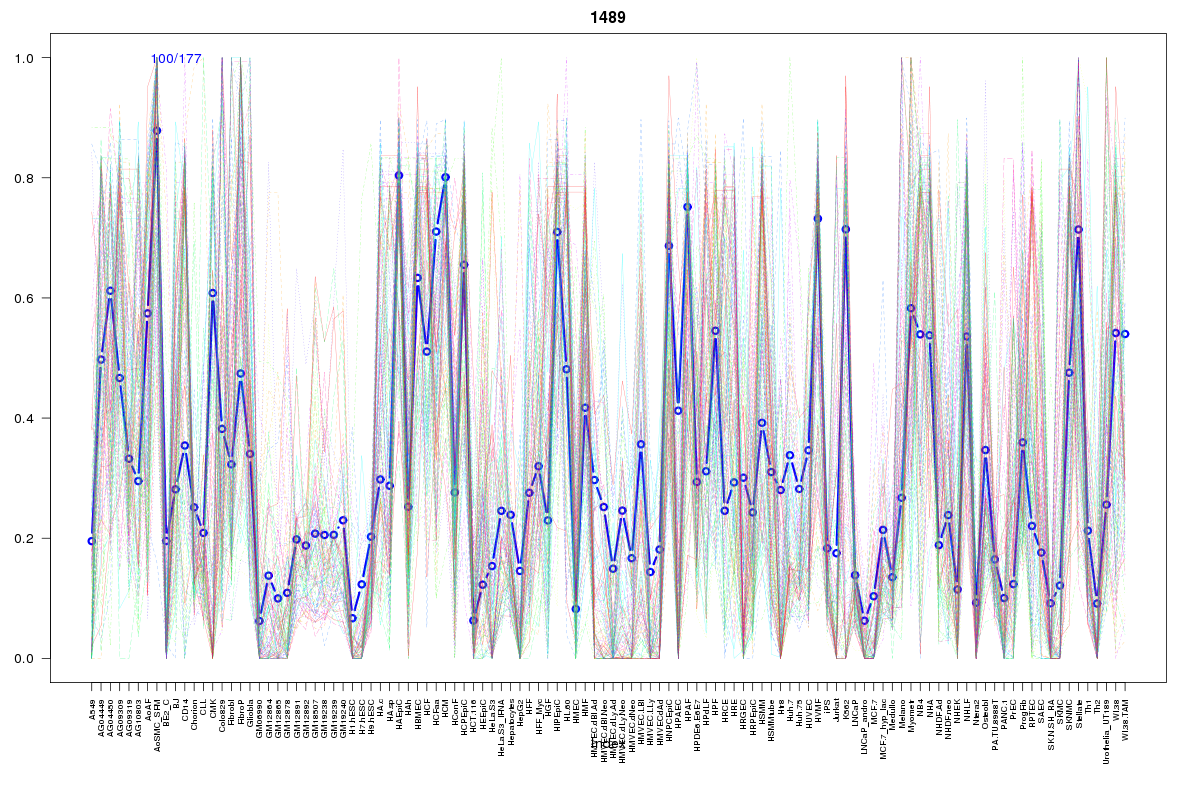 | 1489 | 1 |
 | 89 | 1 |
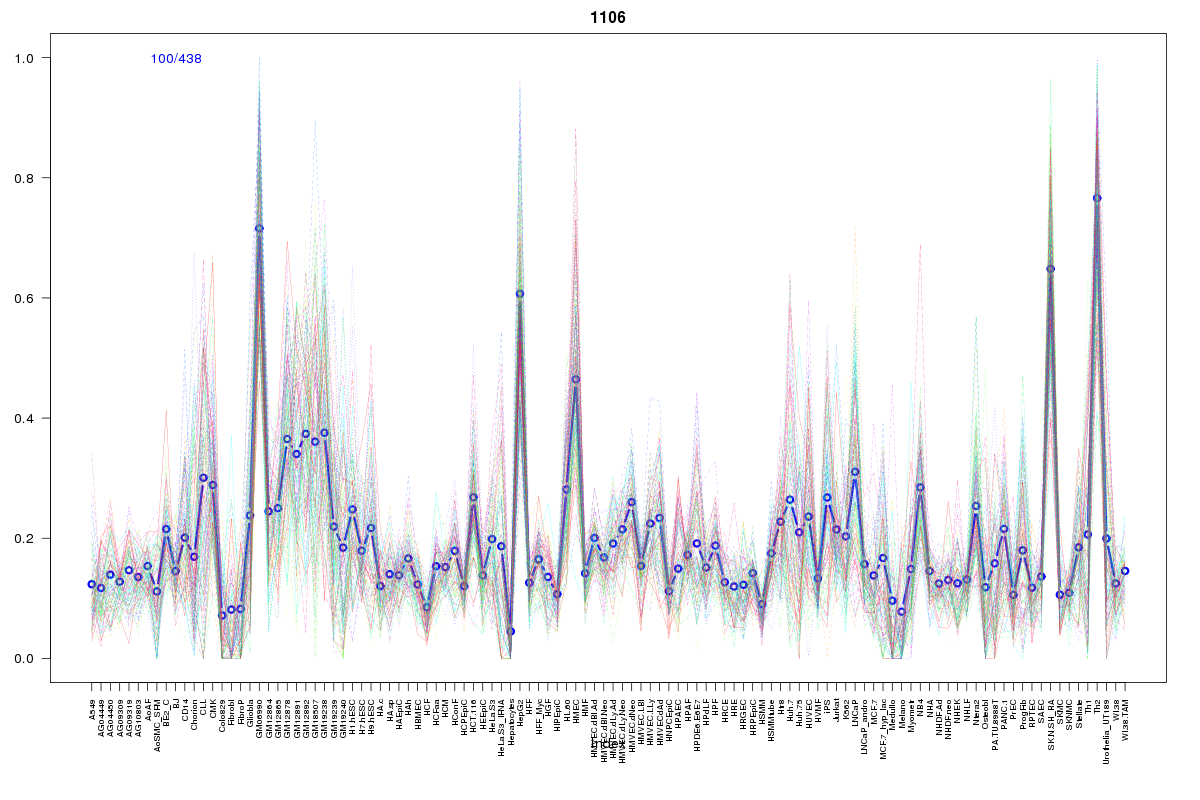 | 1106 | 1 |
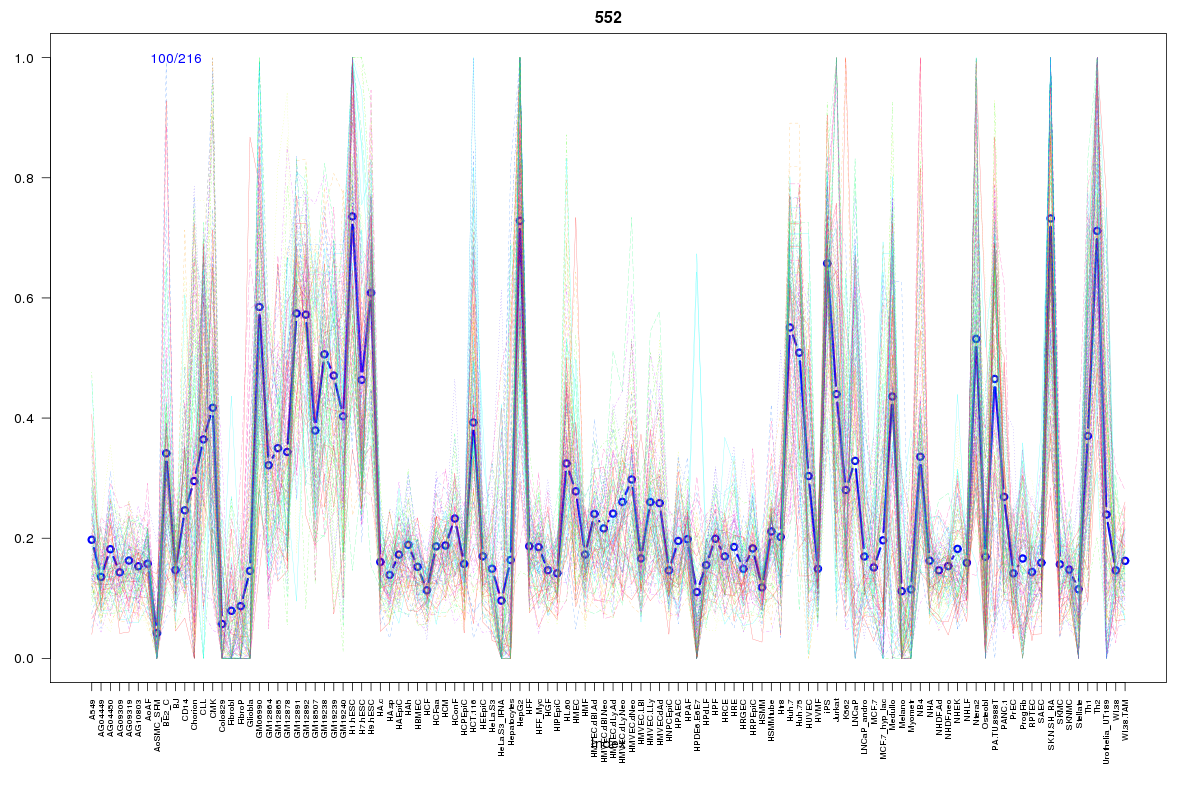 | 552 | 1 |
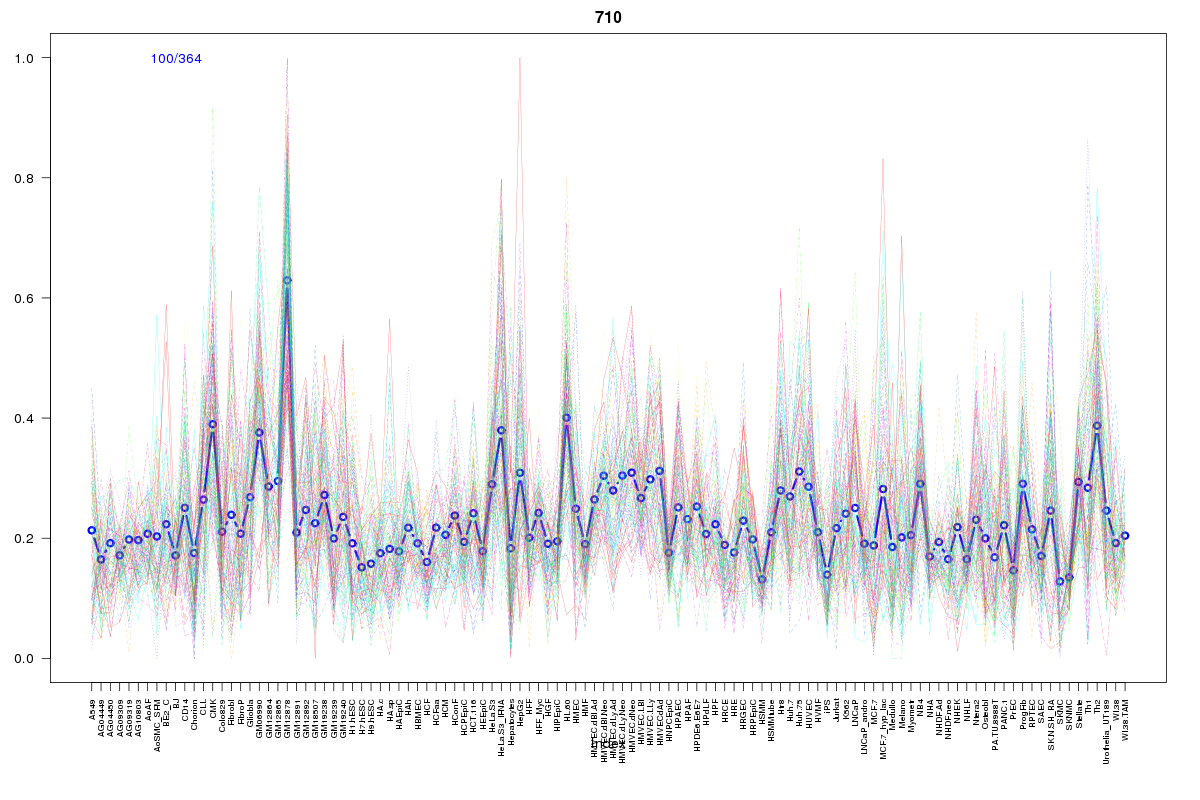 | 710 | 1 |
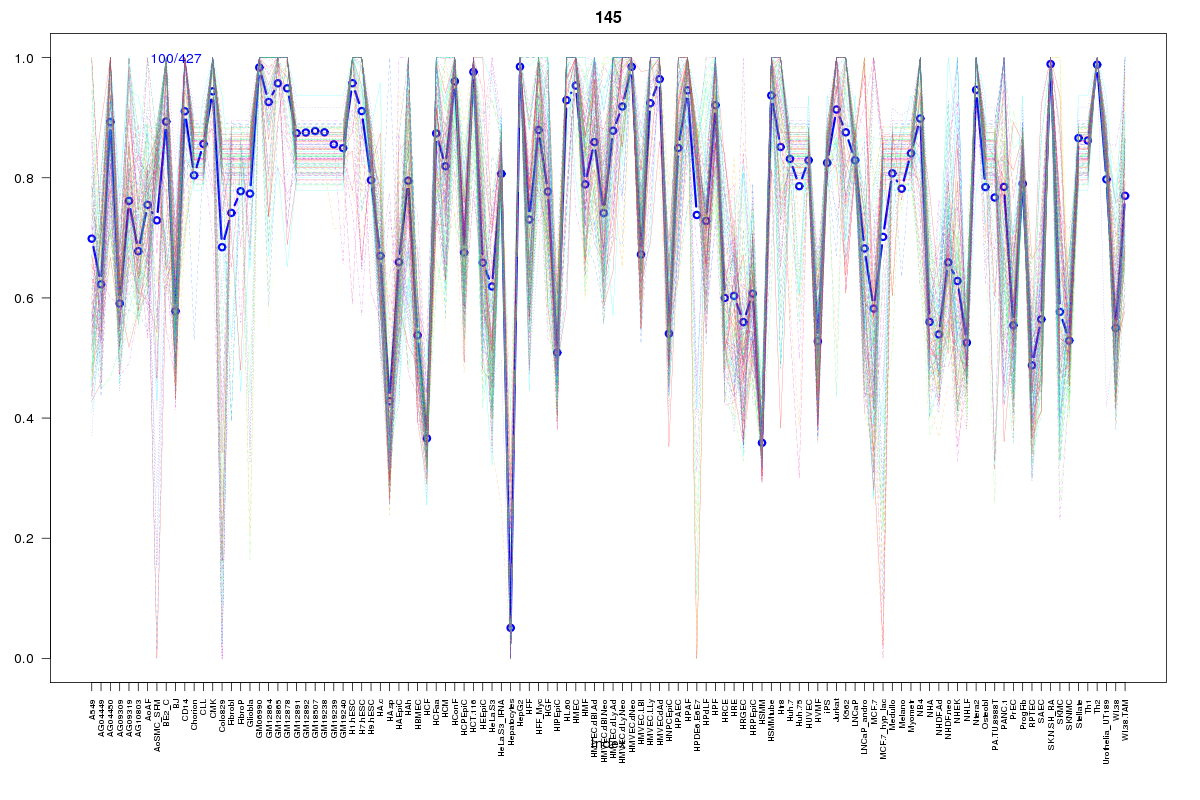 | 145 | 1 |
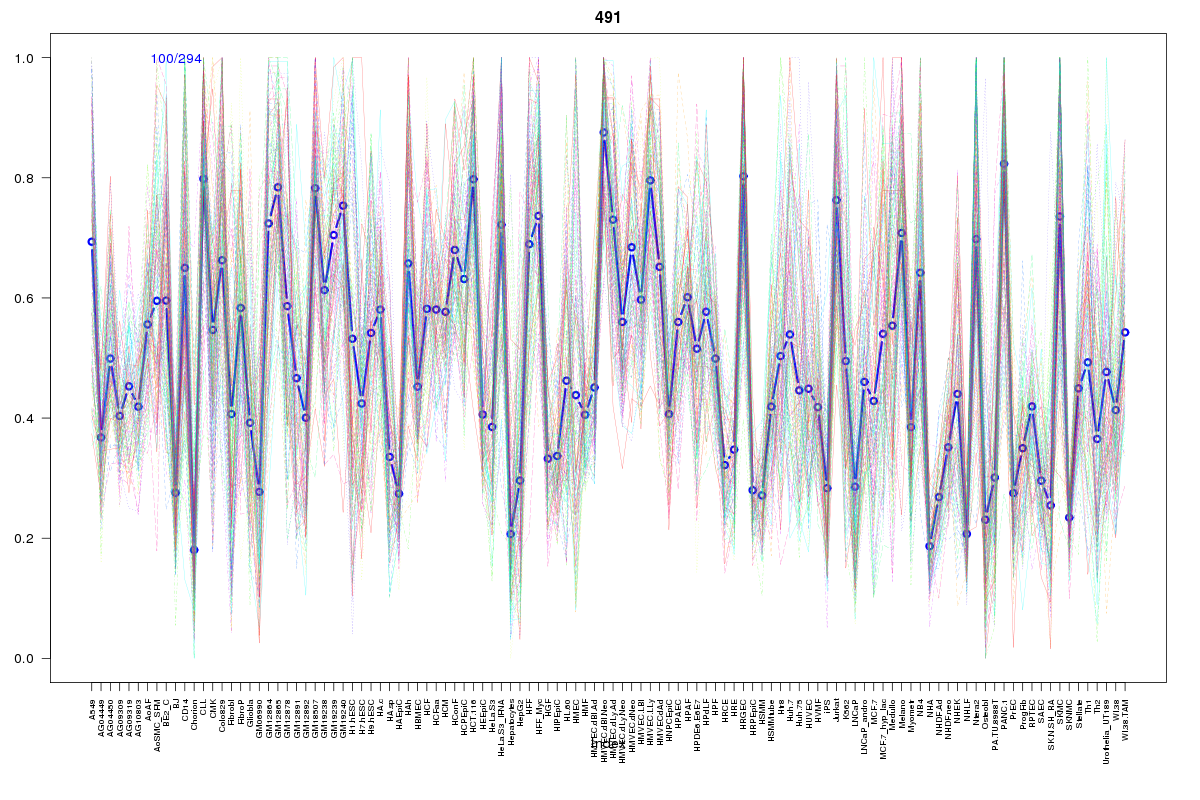 | 491 | 1 |
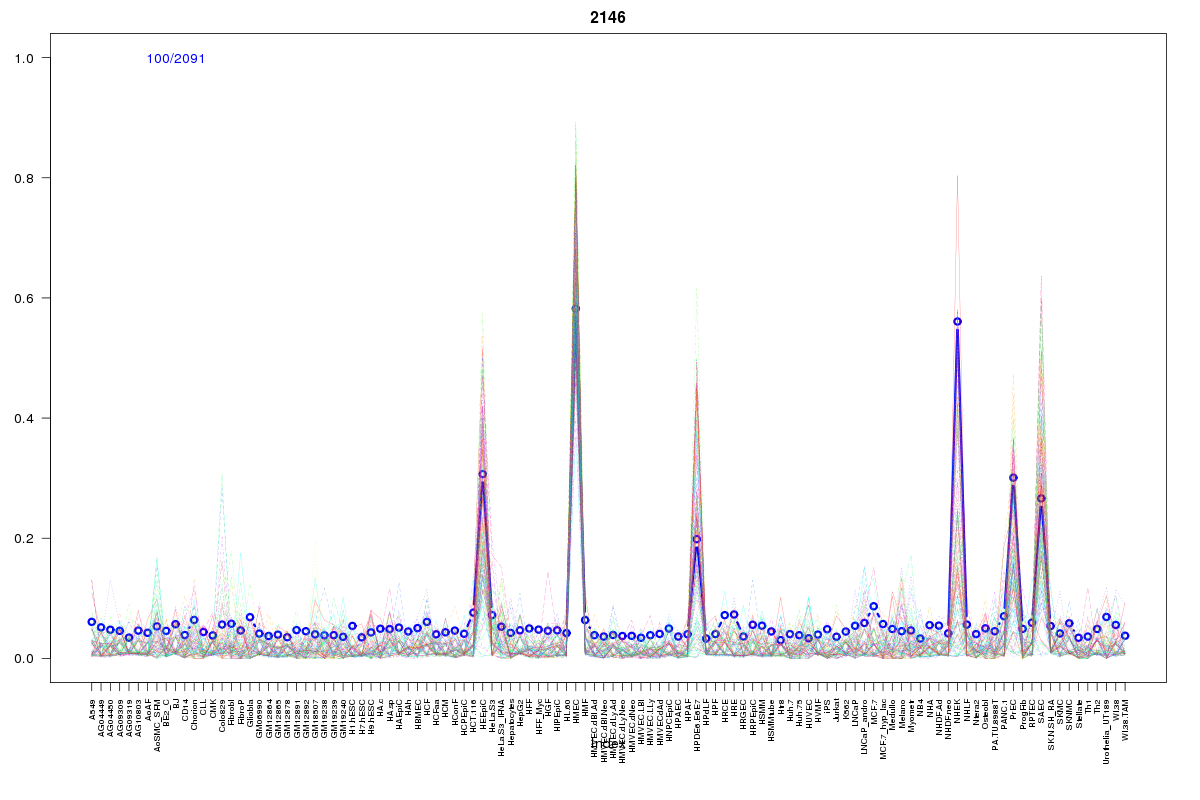 | 2146 | 1 |
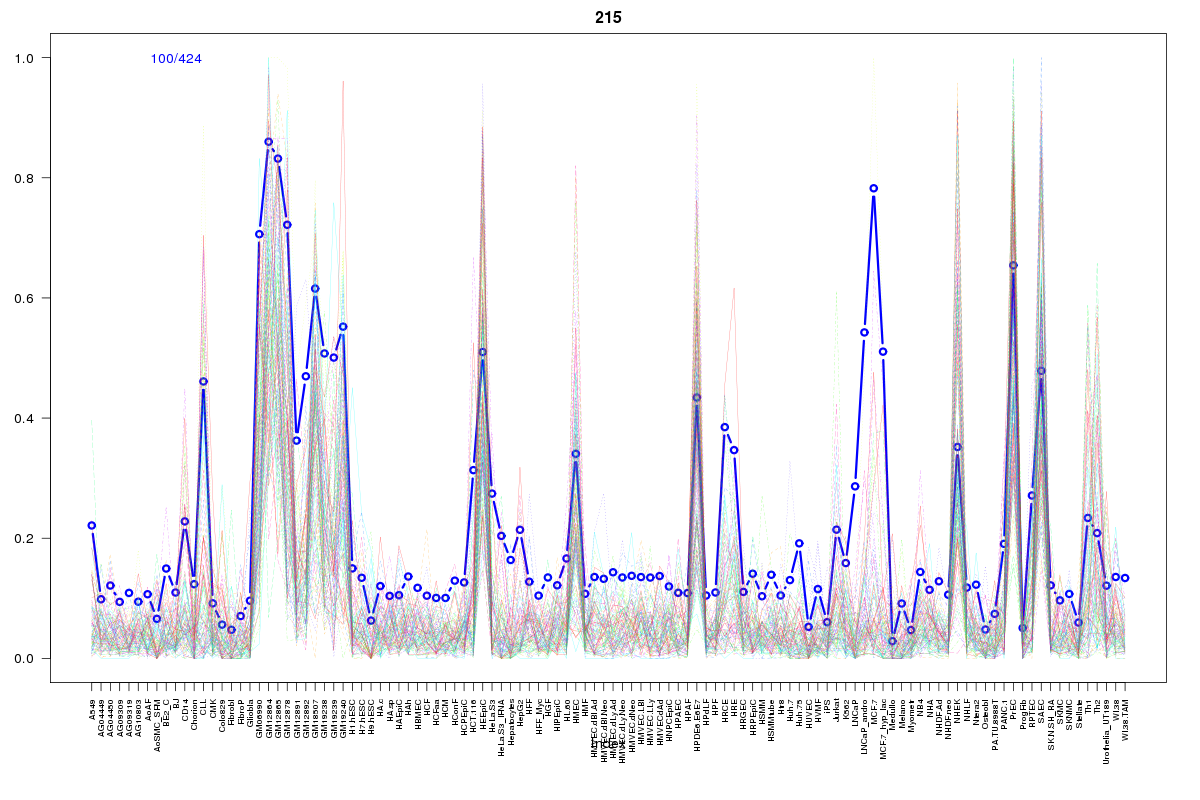 | 215 | 1 |
 | 2195 | 1 |
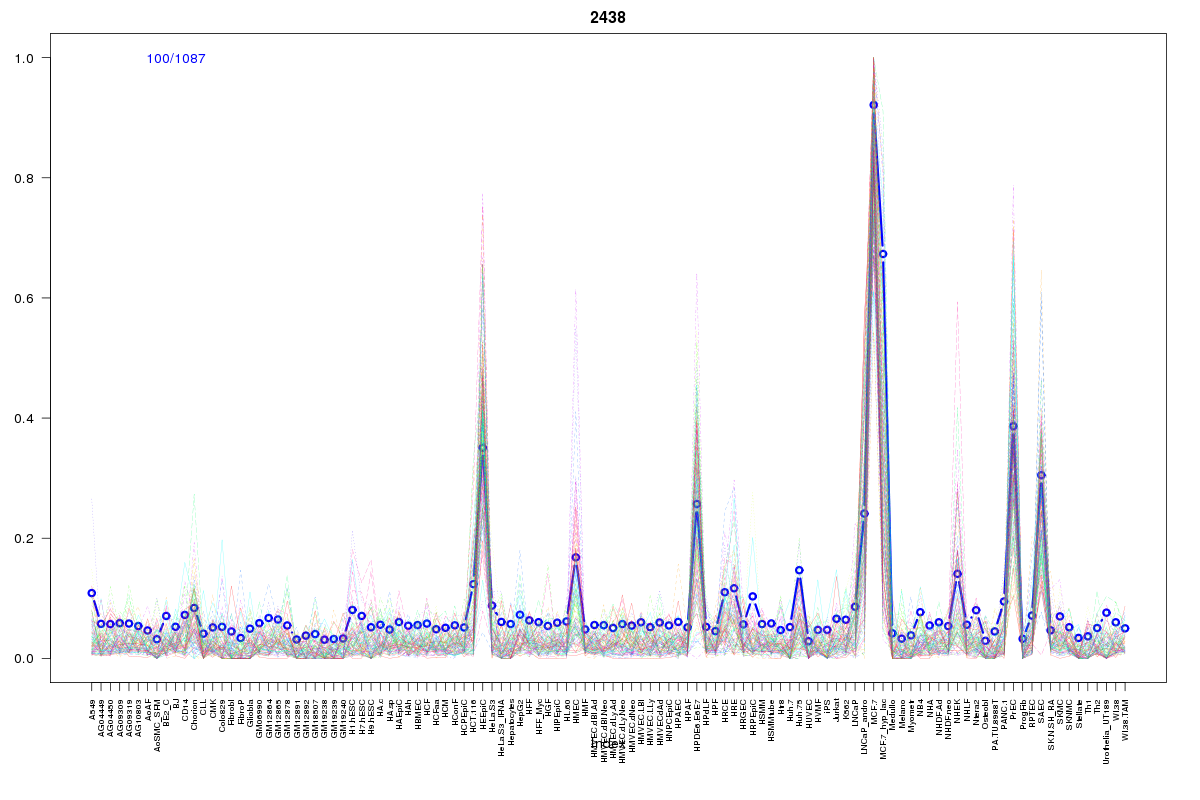 | 2438 | 1 |
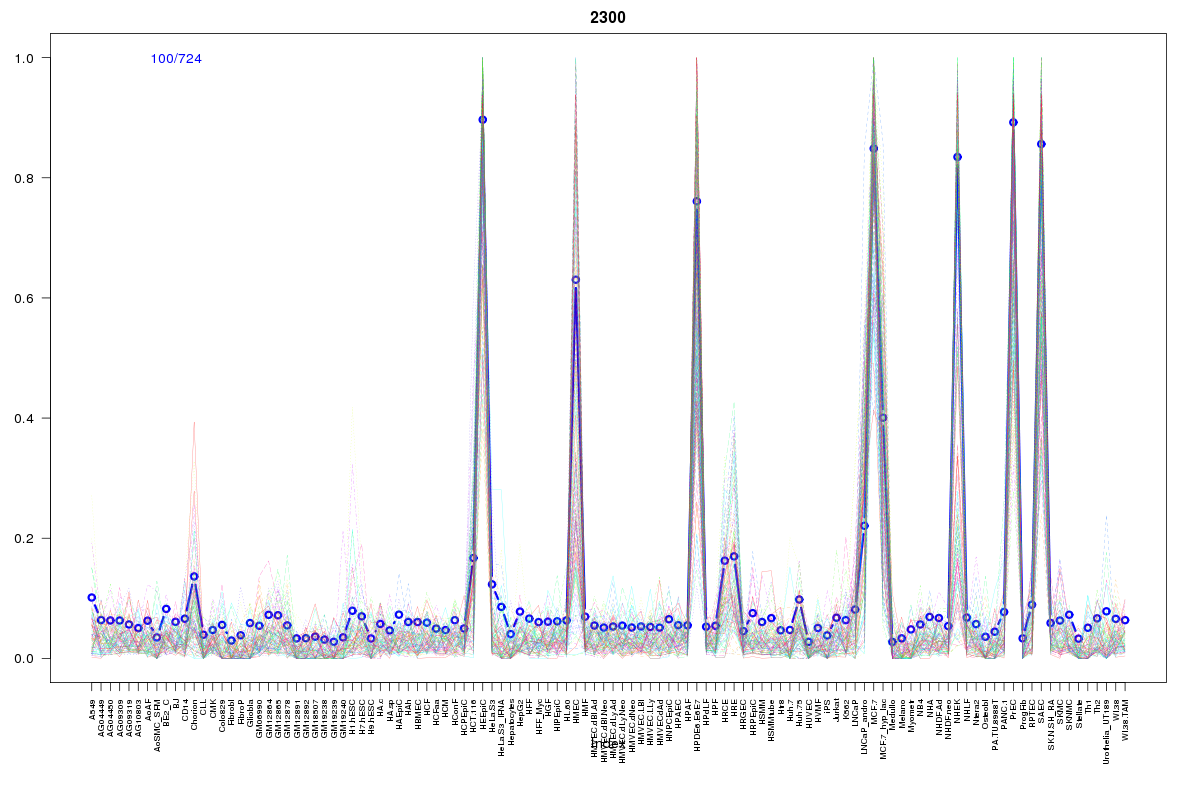 | 2300 | 1 |
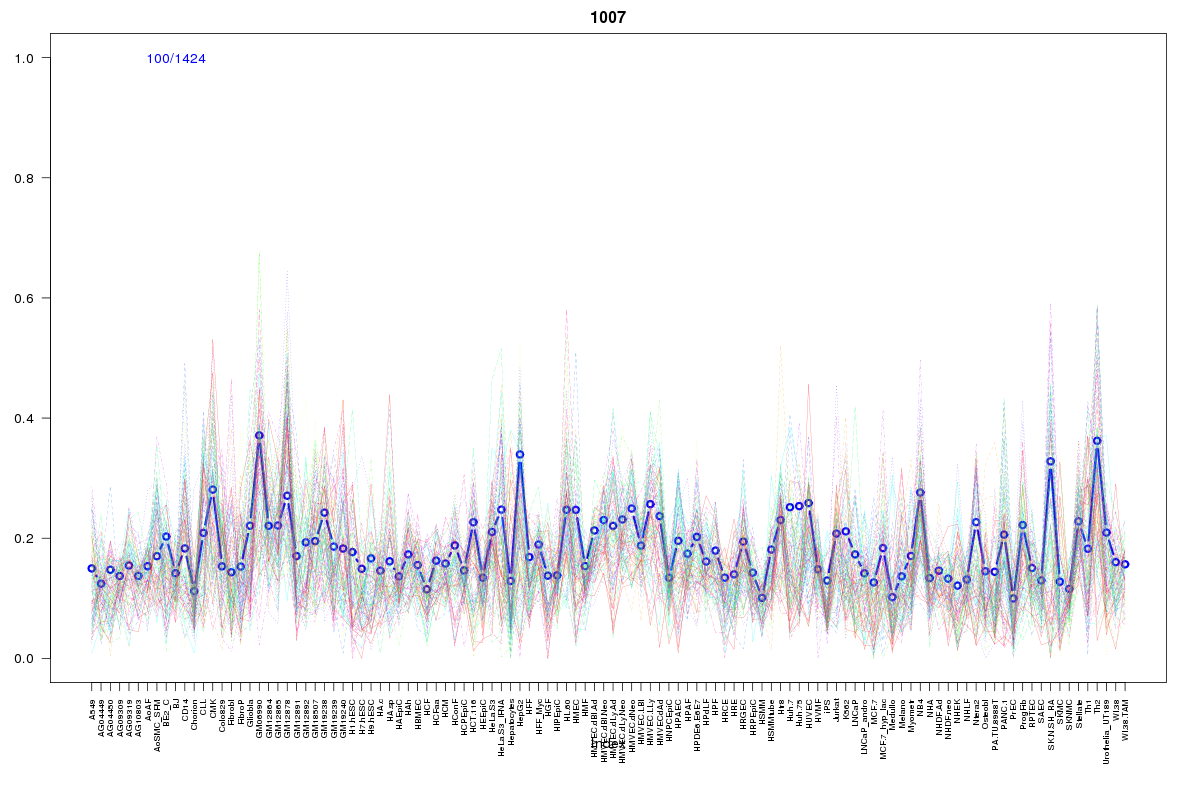 | 1007 | 1 |
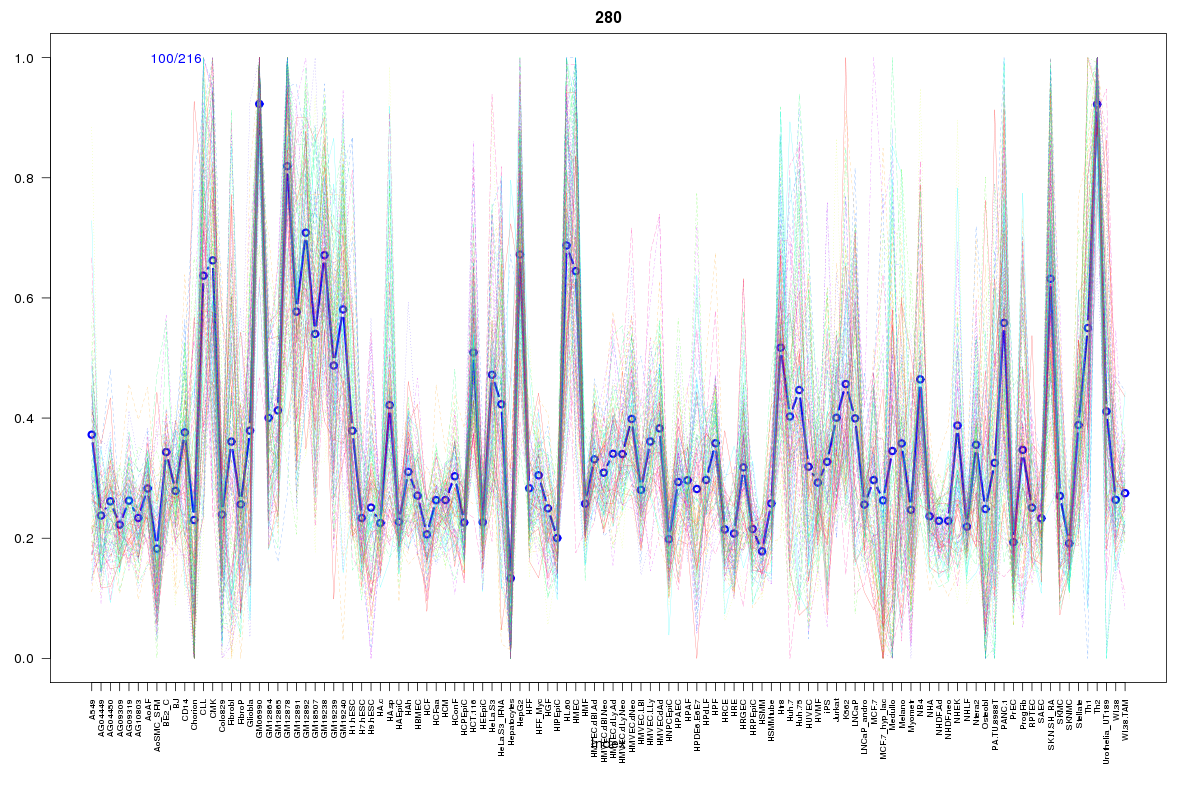 | 280 | 1 |
Resources
BED file downloads
Connects to 30 DHS sitesTop 10 Correlated DHS Sites
p-values indiciate significant higher or lower correlation| Location | Cluster | P-value |
|---|---|---|
| chr3:40430160-40430310 | 2100 | 0 |
| chr3:40429860-40430010 | 2049 | 0 |
| chr3:40429700-40429850 | 2049 | 0 |
| chr3:40459720-40459870 | 2300 | 0.002 |
| chr3:40407840-40407990 | 2100 | 0.002 |
| chr3:40480180-40480330 | 1605 | 0.002 |
| chr3:40408460-40408610 | 2195 | 0.003 |
| chr3:40377700-40377850 | 2146 | 0.004 |
| chr3:40459920-40460070 | 2100 | 0.005 |
| chr3:40459545-40459695 | 2438 | 0.007 |
| chr3:40492260-40492410 | 1605 | 0.007 |
External Databases
UCSCEnsembl (ENSG00000168032)