SOM cluster: 491
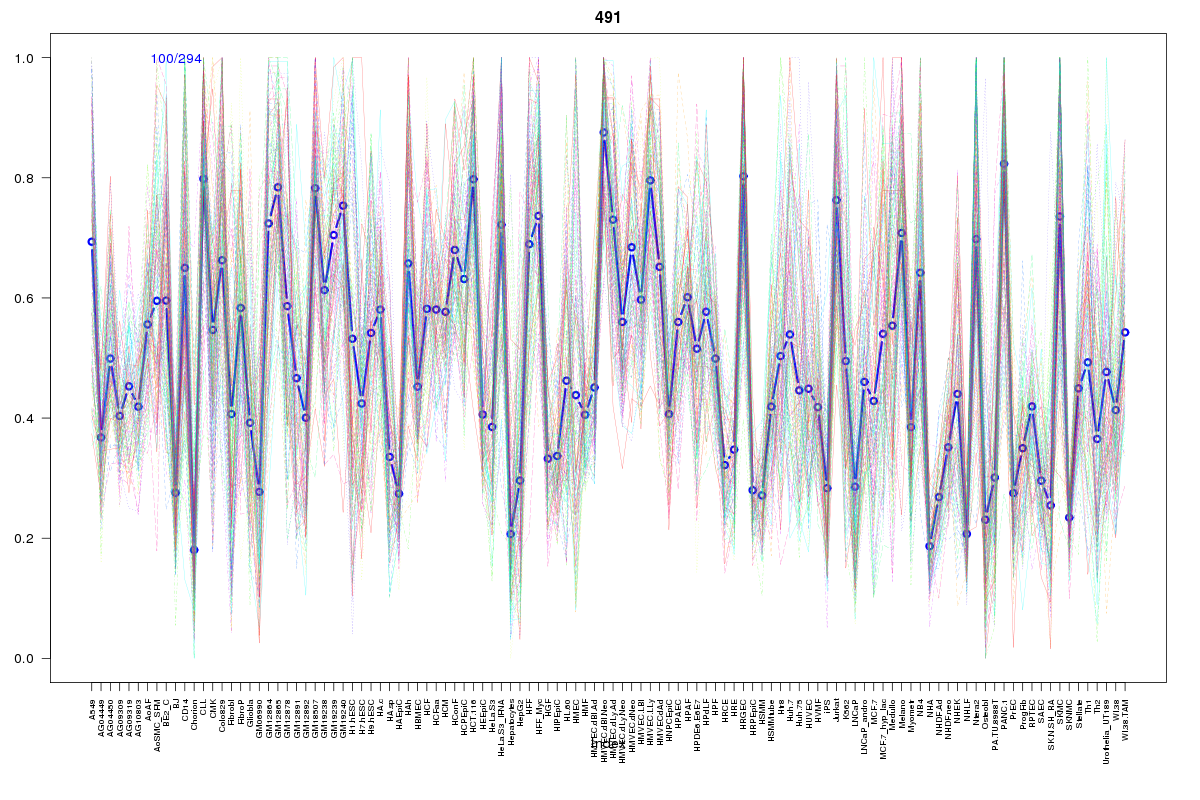
Cluster Hypersensitivity Profile

Genomic Location Trend
These plots show the distribution of the DHS sites surrounding the Transcript Start Site of the nearest gene.
Stats
Number of sites: 294Promoter: 0%
CpG-Island: 0%
Conserved: 82%
Enriched Motifs & Matches
Match Detail: [Jaspar]
|
| ||
|---|---|---|
| Sites: 89/100 | e-val: 0 | ||
| Factor | e-val(match) | DB |
| CTCF | 2.2204e-16 | JASPAR |
| INSM1 | 0.00022339 | JASPAR |
| Zfp423 | 0.0024695 | JASPAR |
| T | 0.013893 | JASPAR |
| MYC::MAX | 0.016595 | JASPAR |
BED file downloads
Top 10 Example Regions
| Location | Gene Link | Dist. |
|---|---|---|
| chr17: 28106380-28106530 | SSH2 | 40.92 |
| chr6: 11655880-11656030 | ADTRP | 48.55 |
| chr6: 11655880-11656030 | RN7SL145P | 48.55 |
| chr20: 4936940-4937090 | RP5-1116H23.1 | 51.36 |
| chr9: 20941200-20941350 | FOCAD | 52.32 |
| chrX: 73235360-73235510 | JPX | 52.99 |
| chr9: 130846240-130846390 | CIZ1 | 54.2 |
| chr8: 96261060-96261210 | KB-1047C11.2 | 54.96 |
| chr19: 34711500-34711650 | RPL29P33 | 55.92 |
| chr6: 26175780-26175930 | HIST1H1PS1 | 58.42 |