SOM cluster: 2146
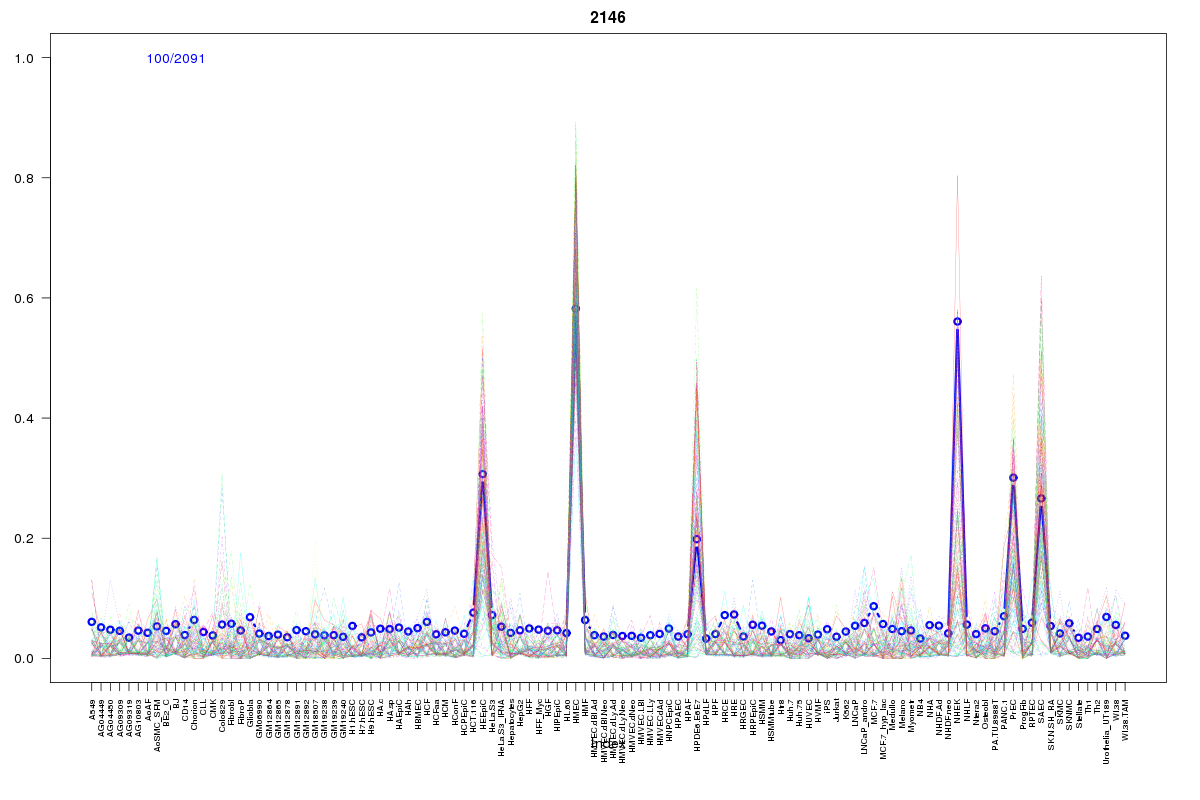
Cluster Hypersensitivity Profile

Genomic Location Trend
These plots show the distribution of the DHS sites surrounding the Transcript Start Site of the nearest gene.
Stats
Number of sites: 2091Promoter: 0%
CpG-Island: 0%
Conserved: 15%
Enriched Motifs & Matches
Match Detail: [Jaspar]
|
| ||
|---|---|---|
| Sites: 55/100 | e-val: 5.2e-31 | ||
| Factor | e-val(match) | DB |
| Lhx3 | 0.000012716 | JASPAR |
| AP1 | 0.00012701 | JASPAR |
| NFE2L2 | 0.00028782 | JASPAR |
| Foxq1 | 0.00085053 | JASPAR |
| ARID3A | 0.0041884 | JASPAR |
|
| ||
| Sites: 23/100 | e-val: 0.55 | ||
| Factor | e-val(match) | DB |
| HNF1B | 0.00000024605 | JASPAR |
| HNF1A | 0.0000034742 | JASPAR |
| ARID3A | 0.000021119 | JASPAR |
| Pax4 | 0.000075105 | JASPAR |
| Lhx3 | 0.00011455 | JASPAR |
BED file downloads
Top 10 Example Regions
| Location | Gene Link | Dist. |
|---|---|---|
| chr8: 6758680-6758830 | DEFB1 | 26.47 |
| chr6: 40387125-40387275 | RP11-552E20.4 | 49.33 |
| chr1: 192831520-192831670 | LINC01032 | 51.29 |
| chr19: 35589685-35589835 | FXYD3 | 52.53 |
| chr1: 46543480-46543630 | TSPAN1 | 52.92 |
| chr8: 134247300-134247450 | NDRG1 | 54.94 |
| chr1: 89830900-89831050 | GBP6 | 55.03 |
| chr19: 45950980-45951130 | ERCC2 | 58.41 |
| chr20: 60816820-60816970 | OSBPL2 | 59.35 |
| chr1: 209948920-209949070 | IRF6 | 61.6 |