Gene: ATG3
chr3: 112251355-112280810Expression Profile
(log scale)
Graphical Connections
Distribution of linked clusters:
You may find it interesting if many of the connected DHS sites belong to the same cluster.| Cluster Profile | Cluster ID | Number of DHS sites in this cluster |
|---|---|---|
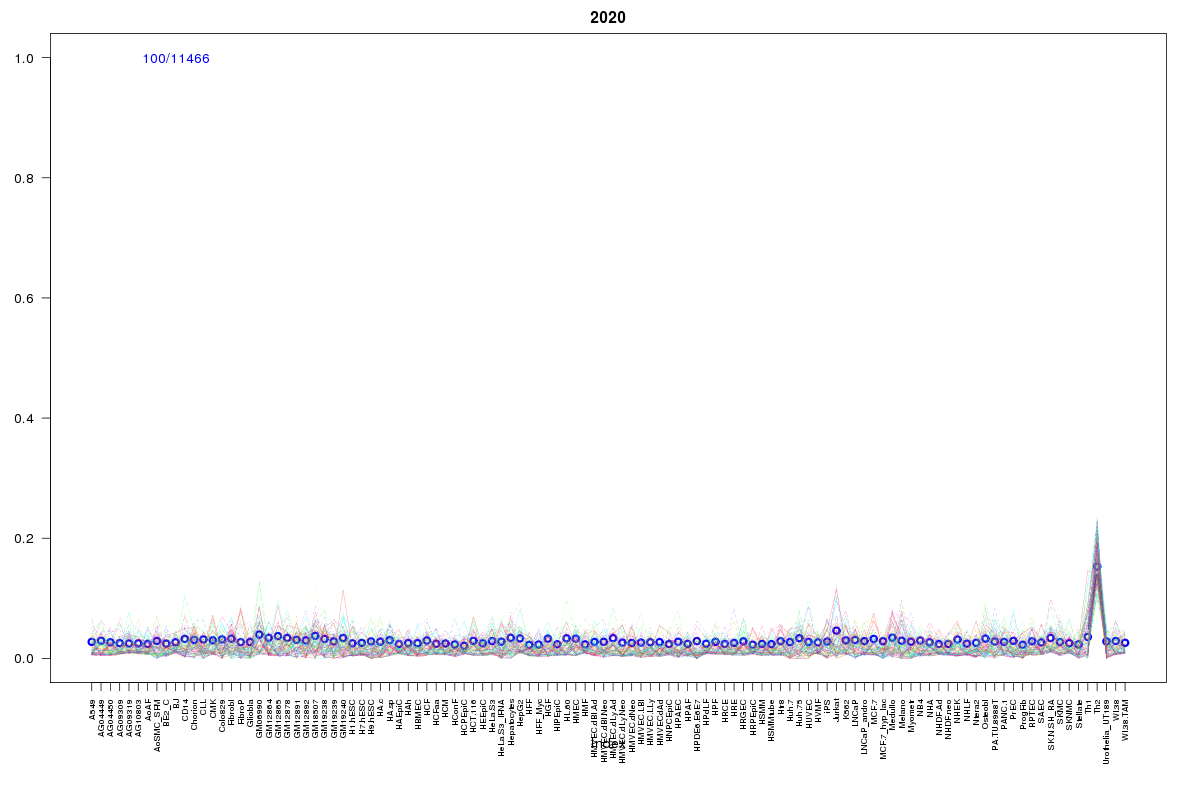 | 2020 | 1 |
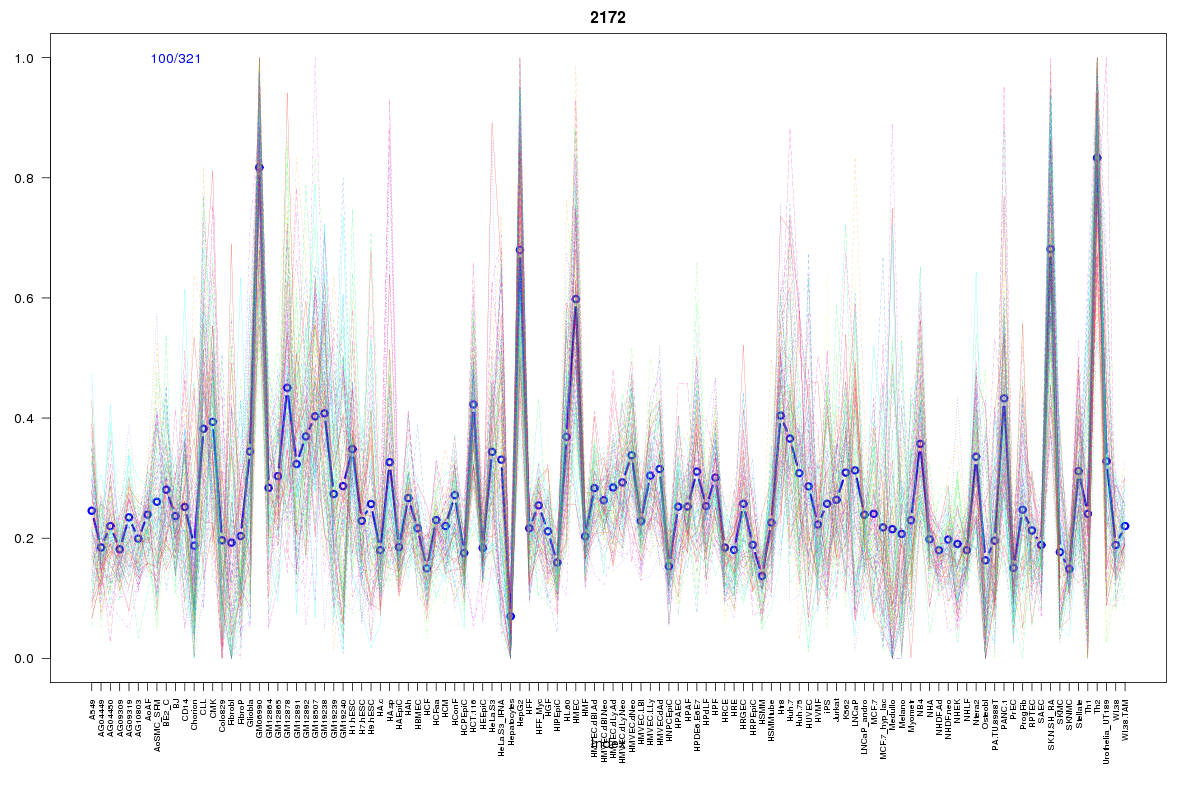 | 2172 | 1 |
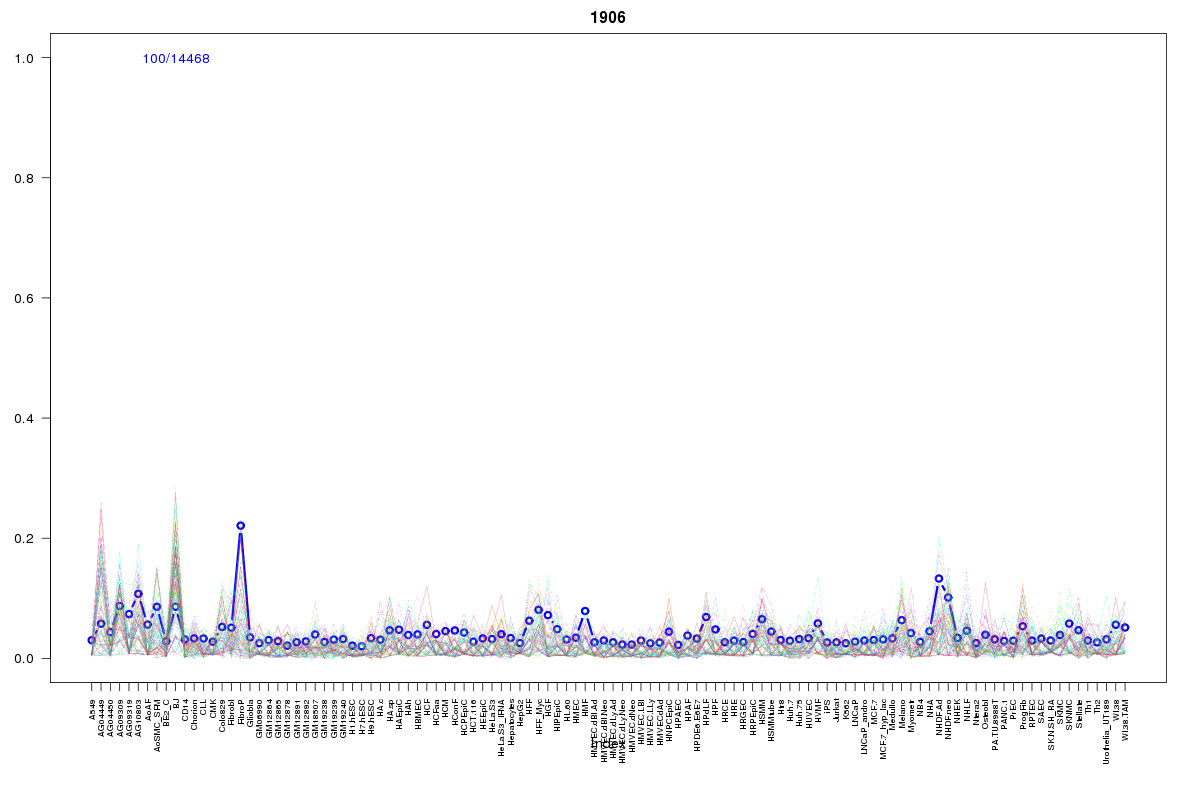 | 1906 | 1 |
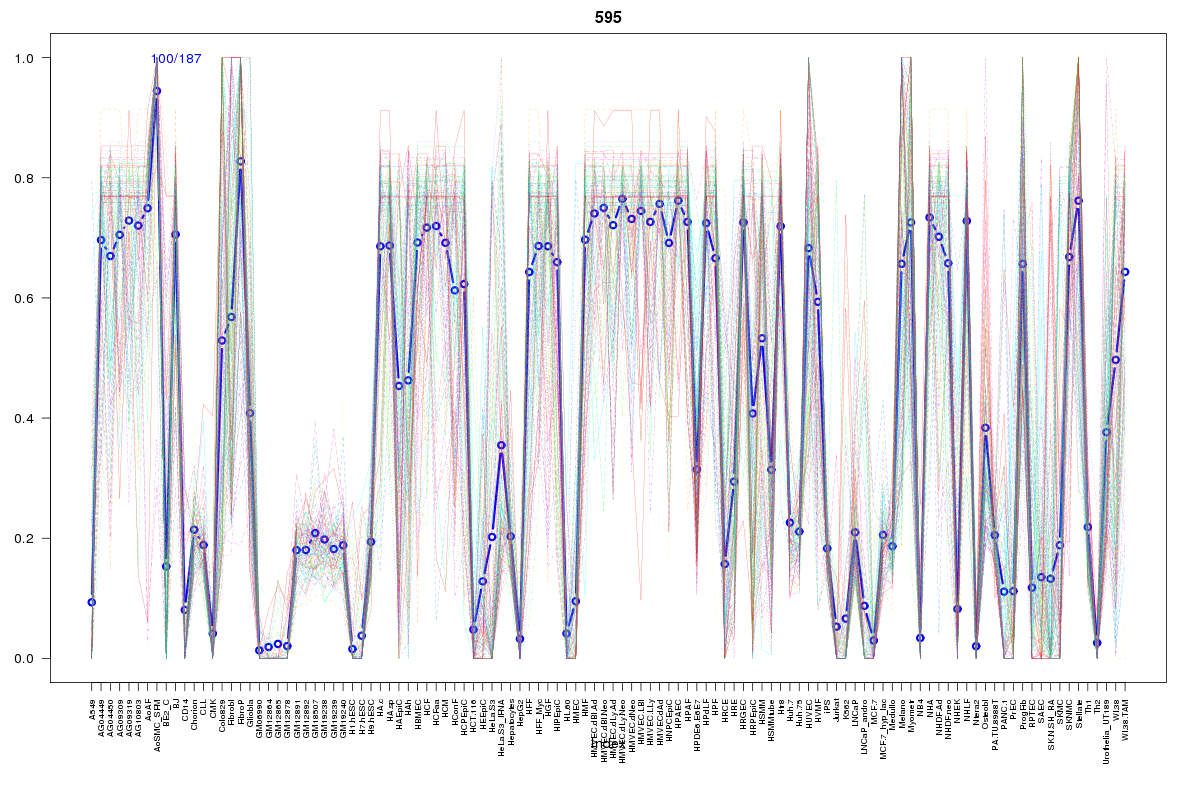 | 595 | 1 |
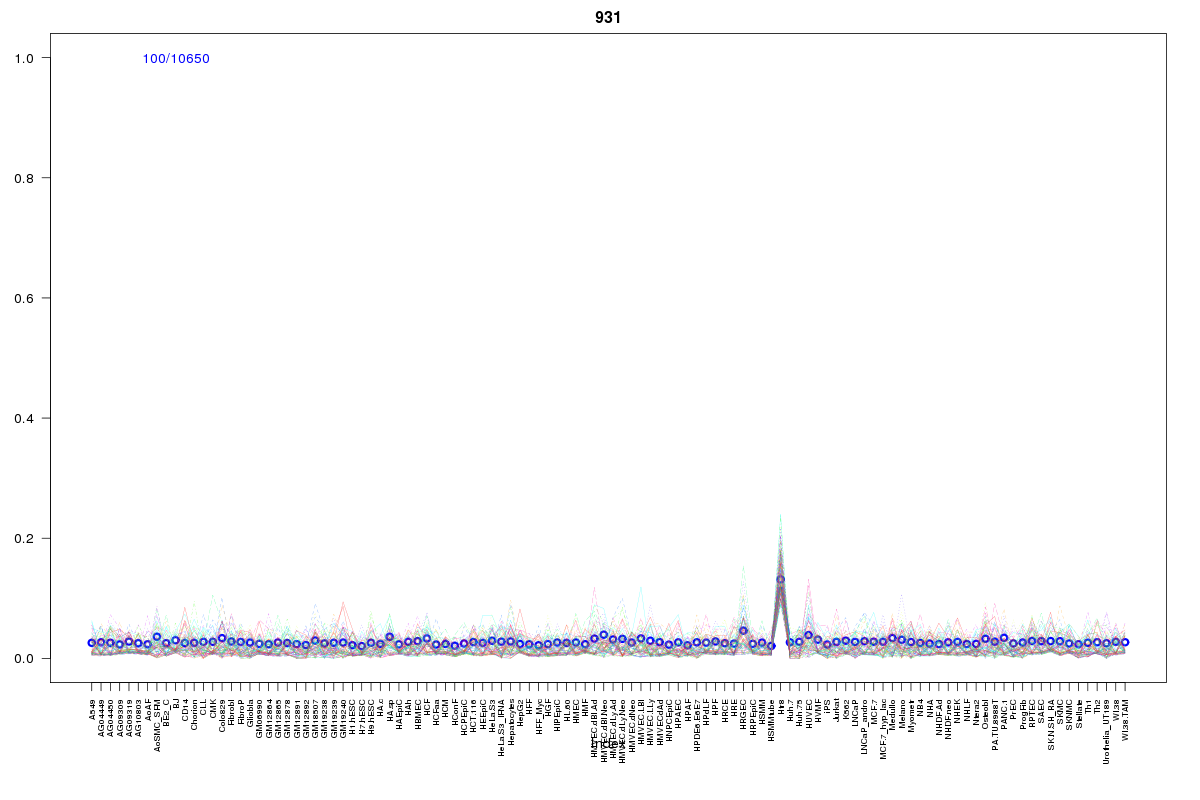 | 931 | 1 |
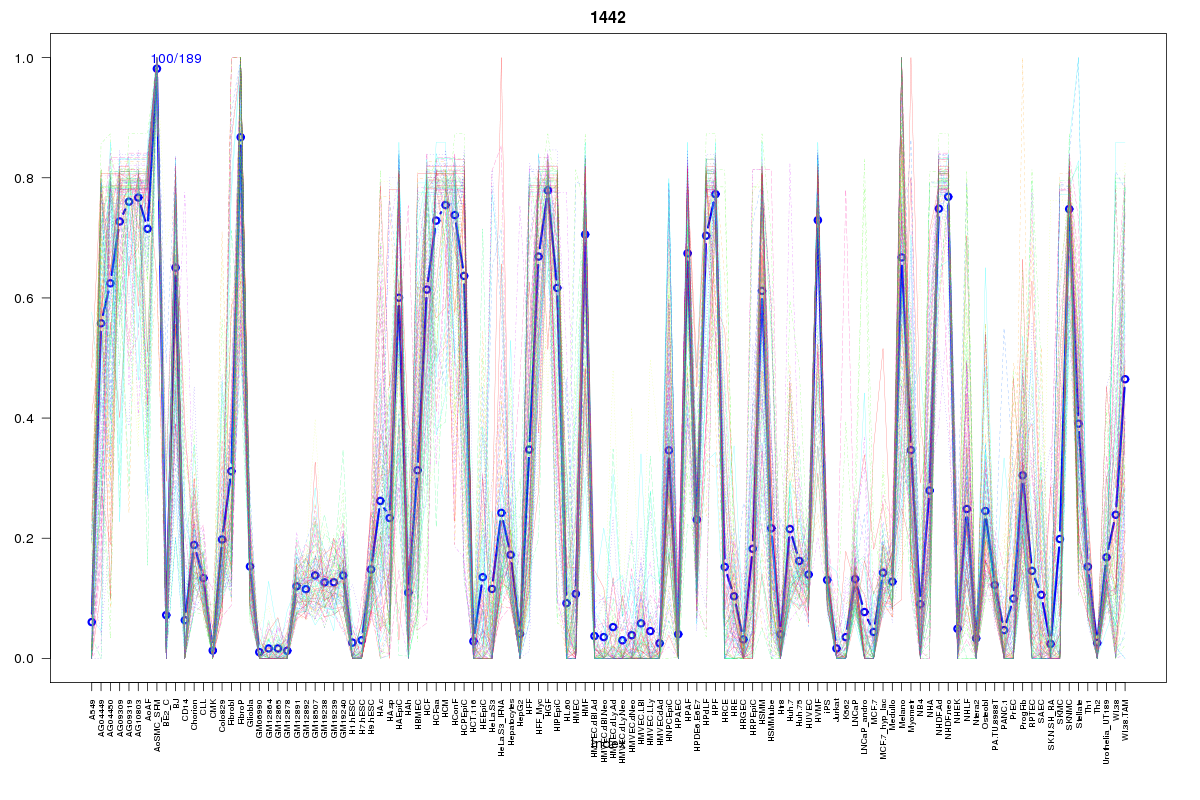 | 1442 | 1 |
 | 1099 | 1 |
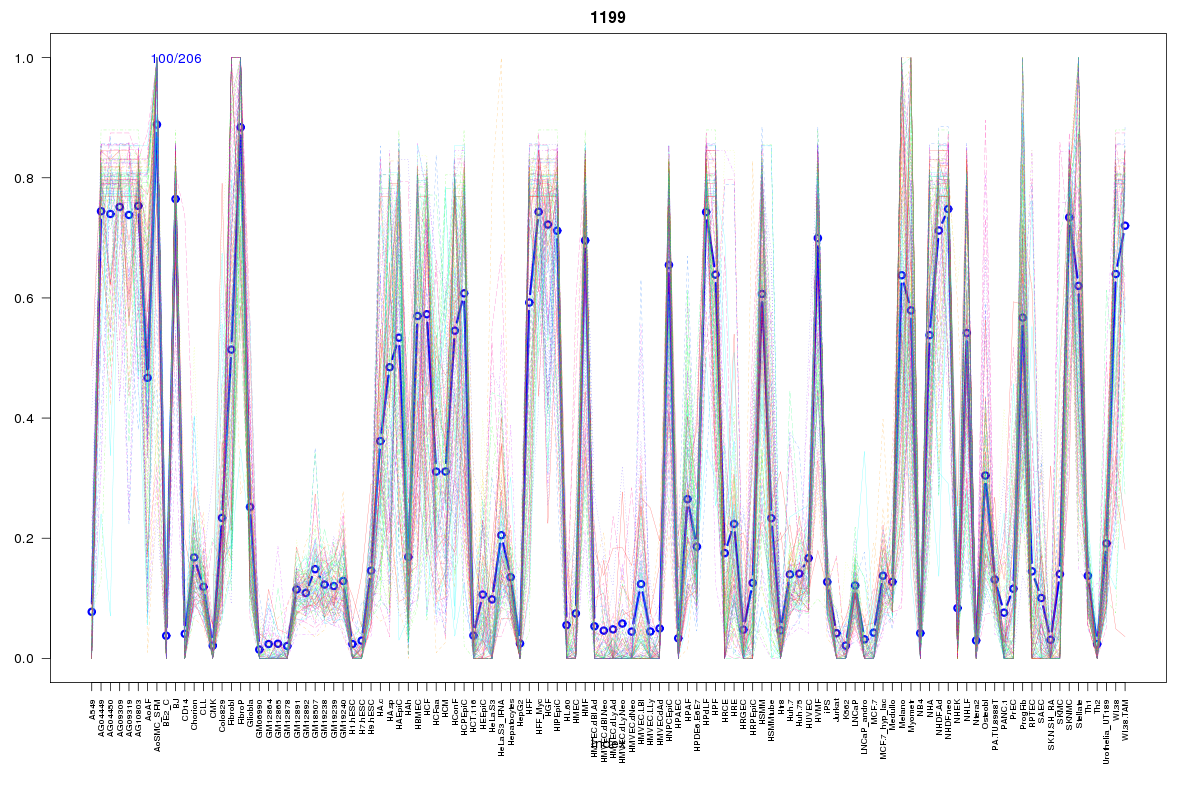 | 1199 | 1 |
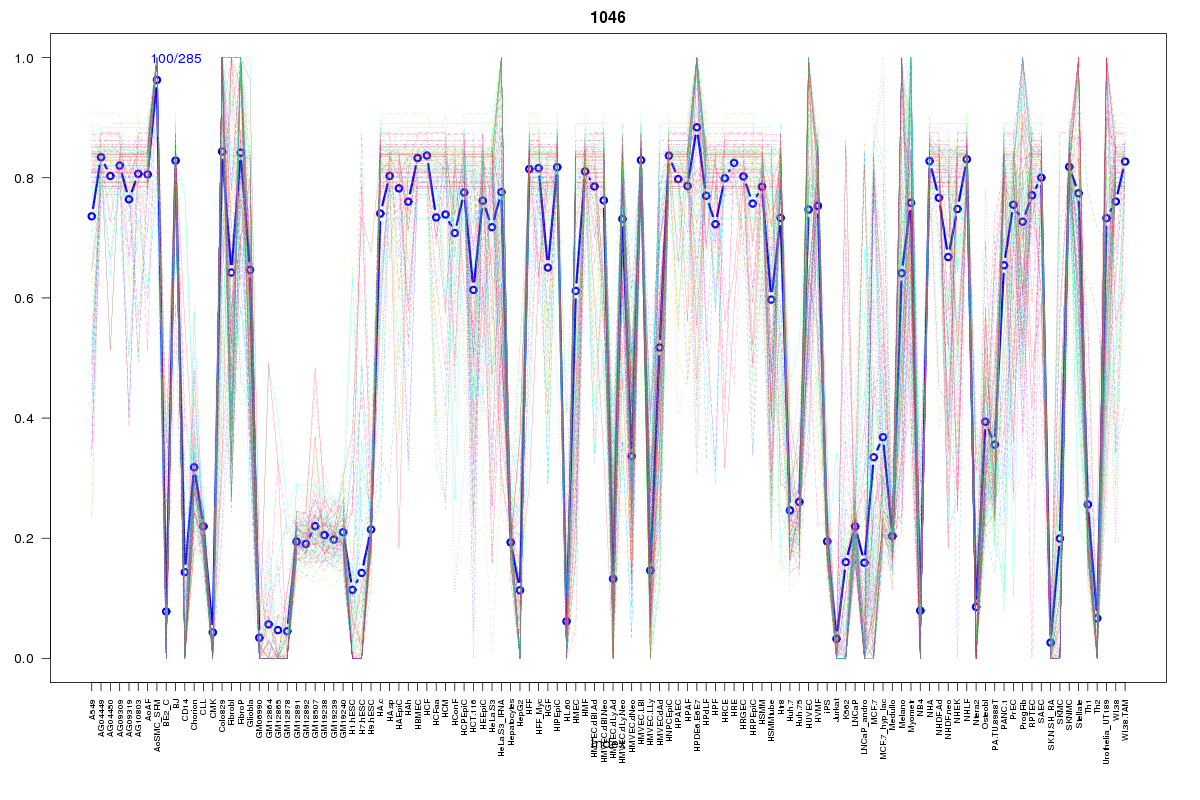 | 1046 | 1 |
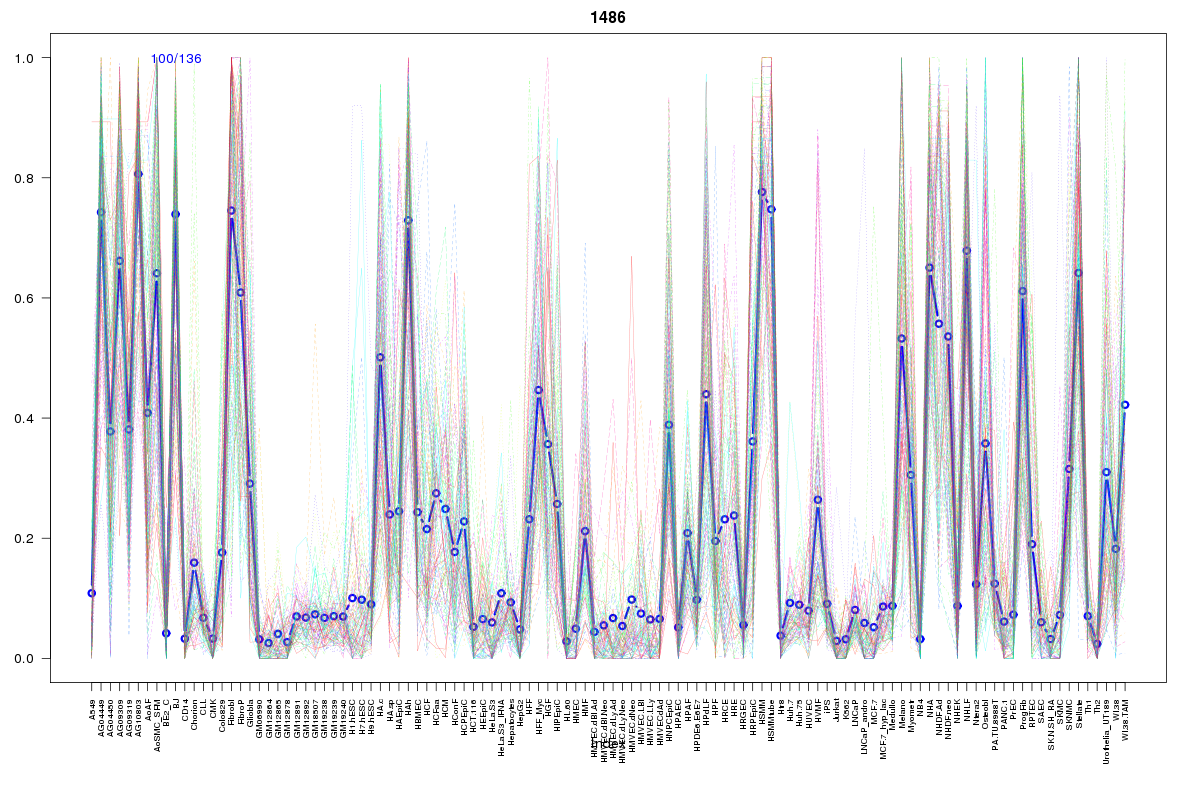 | 1486 | 1 |
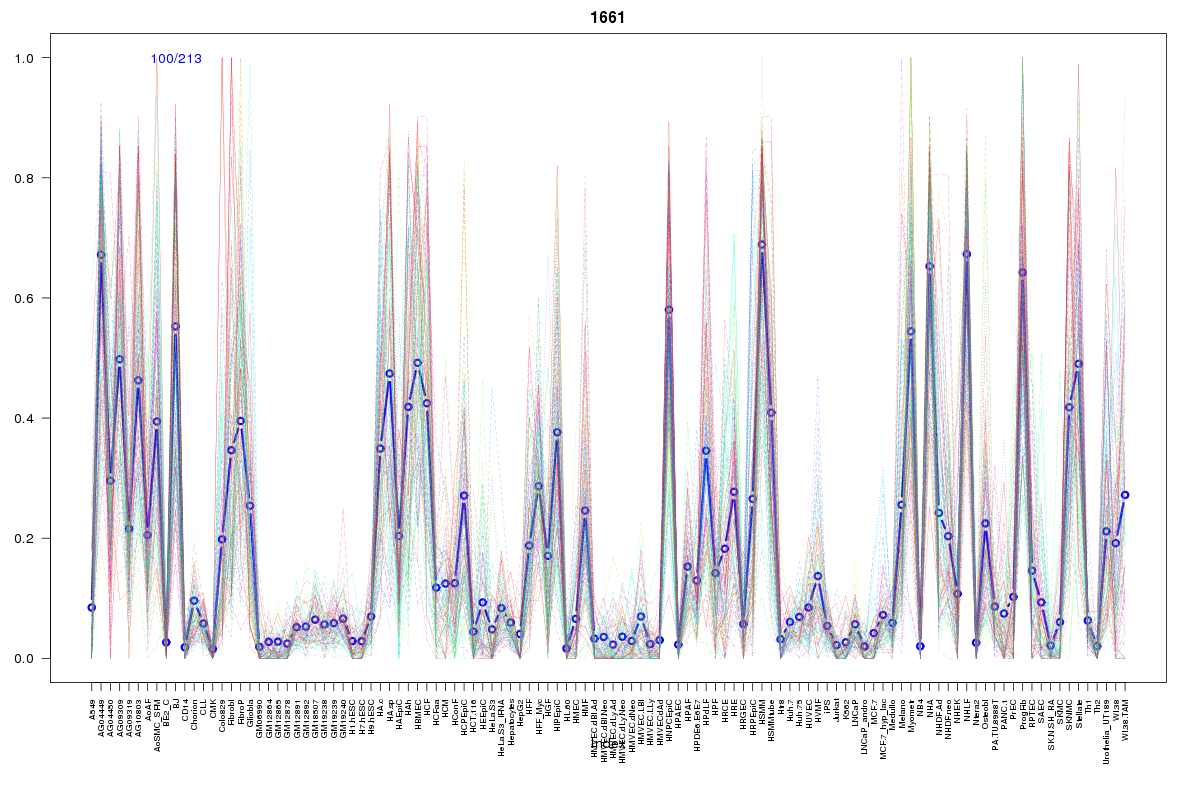 | 1661 | 1 |
Resources
BED file downloads
Connects to 11 DHS sitesTop 10 Correlated DHS Sites
p-values indiciate significant higher or lower correlation| Location | Cluster | P-value |
|---|---|---|
| chr3:112280240-112280390 | 2172 | 0.009 |
| chr3:112222485-112222635 | 2020 | 0.023 |
| chr3:112354765-112354915 | 1199 | 0.02 |
| chr3:112304700-112304850 | 1906 | 0.015 |
| chr3:112323500-112323650 | 595 | 0.01 |
| chr3:112359940-112360090 | 1046 | 0.01 |
| chr3:112348300-112348450 | 1442 | 0.007 |
| chr3:112354600-112354750 | 1099 | 0.004 |
| chr3:112326640-112326790 | 931 | 0.004 |
| chr3:112370520-112370670 | 1661 | 0.001 |
| chr3:112368320-112368470 | 1486 | 0 |
External Databases
UCSCEnsembl (ENSG00000144848)