SOM cluster: 1486
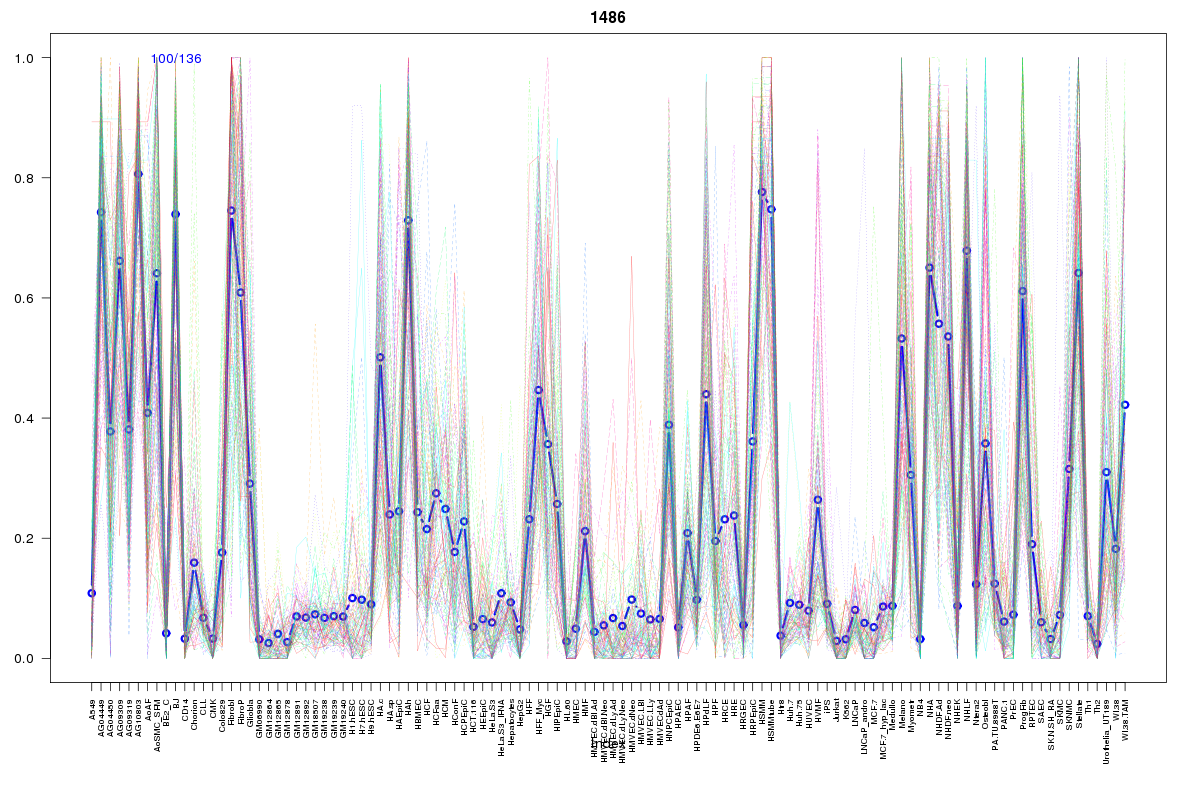
Cluster Hypersensitivity Profile

Genomic Location Trend
These plots show the distribution of the DHS sites surrounding the Transcript Start Site of the nearest gene.
Stats
Number of sites: 136Promoter: 0%
CpG-Island: 0%
Conserved: 44%
Enriched Motifs & Matches
Match Detail: [Jaspar]
|
| ||
|---|---|---|
| Sites: 35/100 | e-val: 0.00044 | ||
| Factor | e-val(match) | DB |
| TEAD1 | 0.000000000021445 | JASPAR |
| RELA | 0.00026868 | JASPAR |
| SPI1 | 0.00043742 | JASPAR |
| FEV | 0.001884 | JASPAR |
| SPIB | 0.0020828 | JASPAR |
BED file downloads
Top 10 Example Regions
| Location | Gene Link | Dist. |
|---|---|---|
| chr3: 43775340-43775490 | ANO10 | 52.98 |
| chr10: 80477060-80477210 | LINC00856 | 57.46 |
| chr15: 61343860-61344010 | RORA | 62.29 |
| chr15: 89533040-89533190 | MFGE8 | 63.55 |
| chr17: 25691180-25691330 | RPS16P8 | 64.57 |
| chr12: 106474140-106474290 | NUAK1 | 69.54 |
| chr2: 69222120-69222270 | GKN2 | 73.85 |
| chr2: 69222120-69222270 | ANTXR1 | 73.85 |
| chr3: 112368320-112368470 | ATG3 | 74.83 |
| chr3: 112368320-112368470 | CCDC80 | 74.83 |