Gene: ACTR1A
chr10: 104238985-104262468Expression Profile
(log scale)
Graphical Connections
Distribution of linked clusters:
You may find it interesting if many of the connected DHS sites belong to the same cluster.| Cluster Profile | Cluster ID | Number of DHS sites in this cluster |
|---|---|---|
 | 626 | 2 |
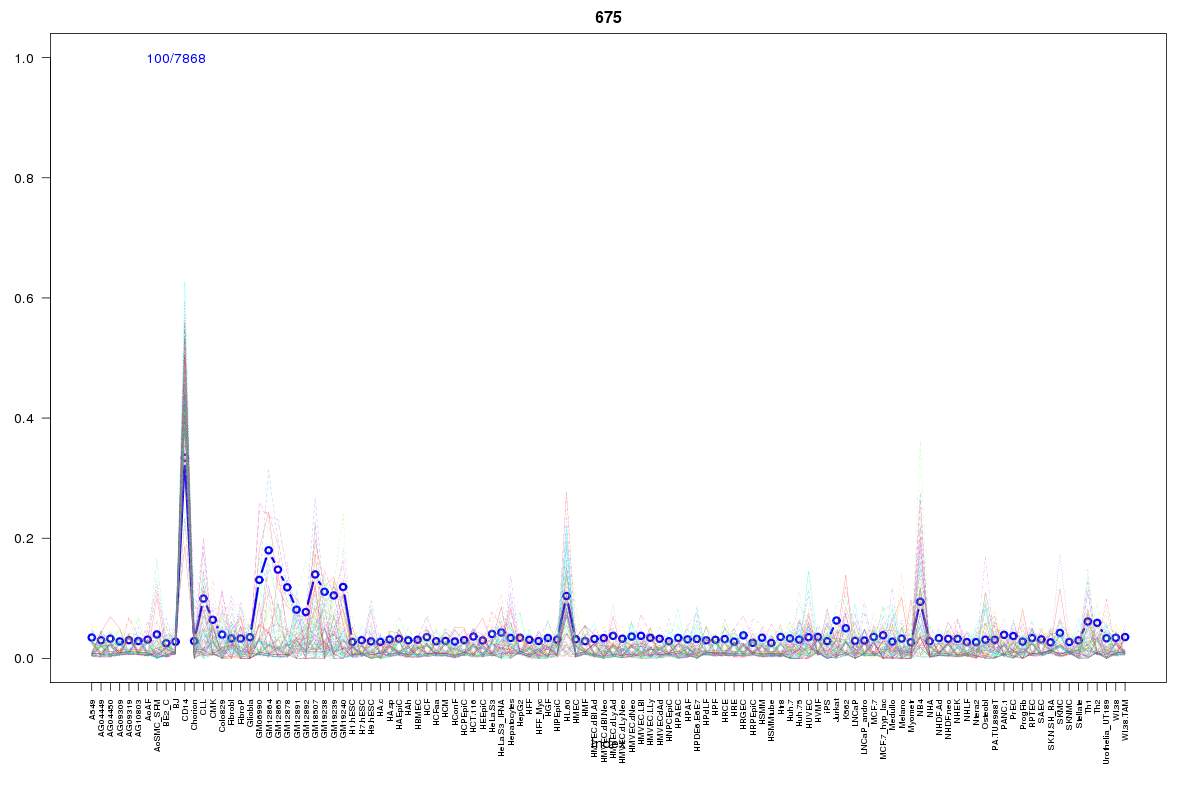 | 675 | 2 |
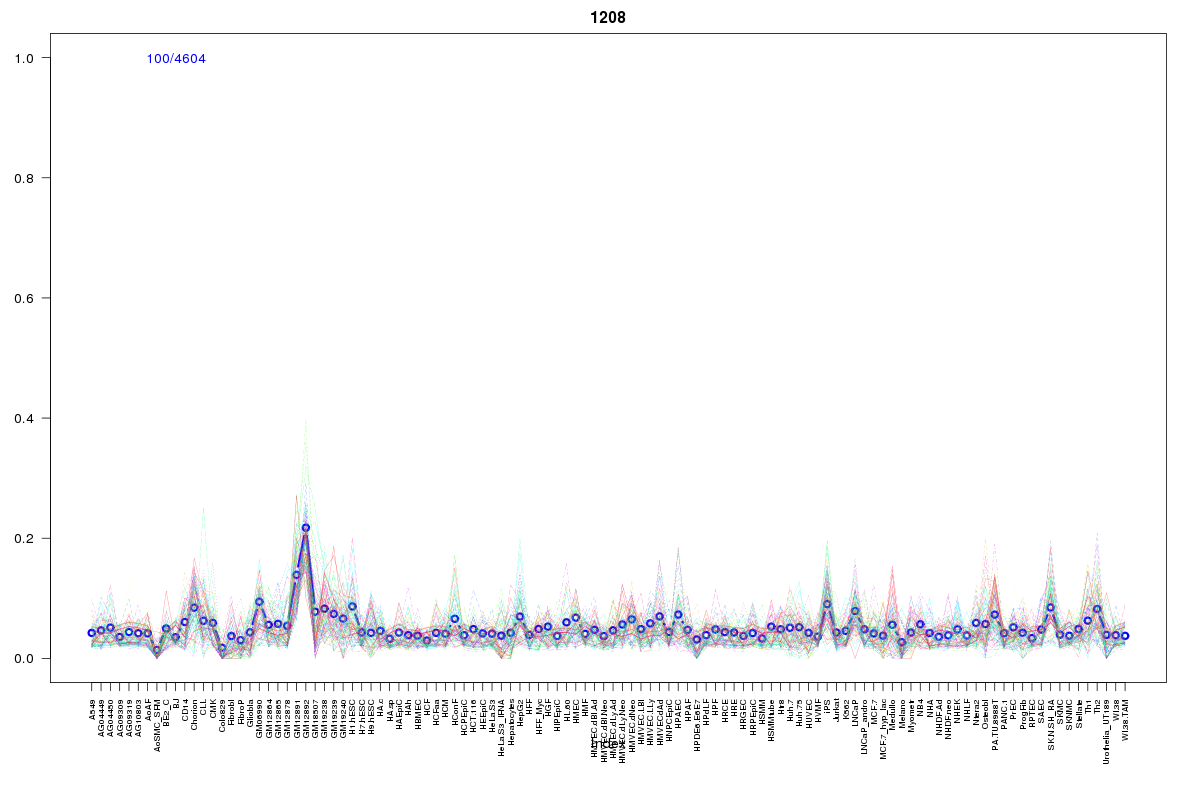 | 1208 | 1 |
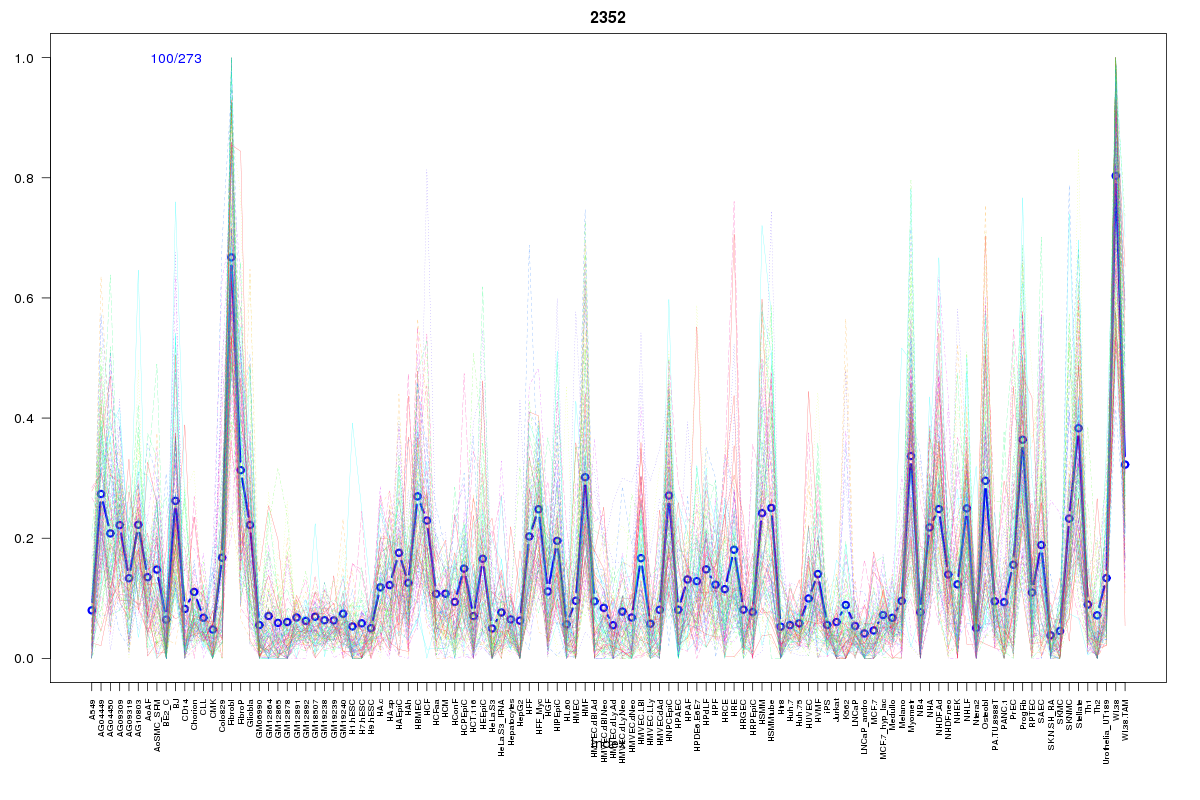 | 2352 | 1 |
 | 1535 | 1 |
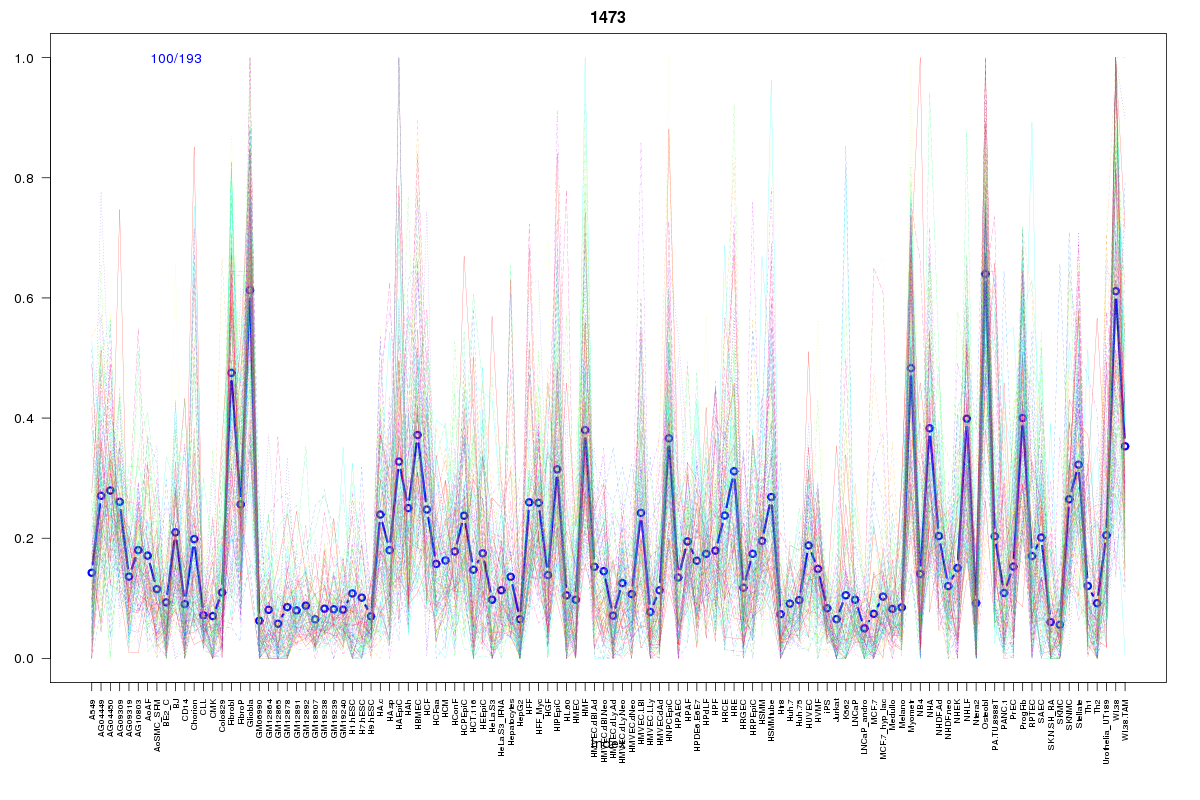 | 1473 | 1 |
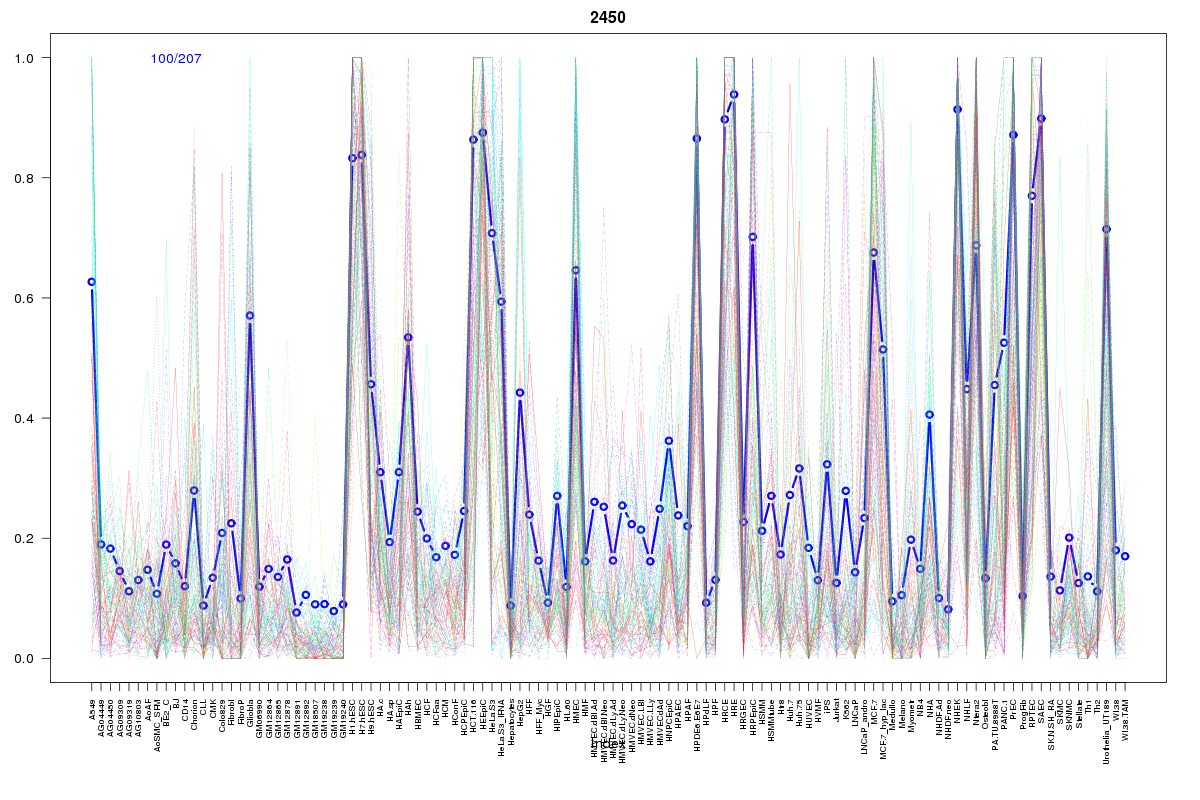 | 2450 | 1 |
 | 570 | 1 |
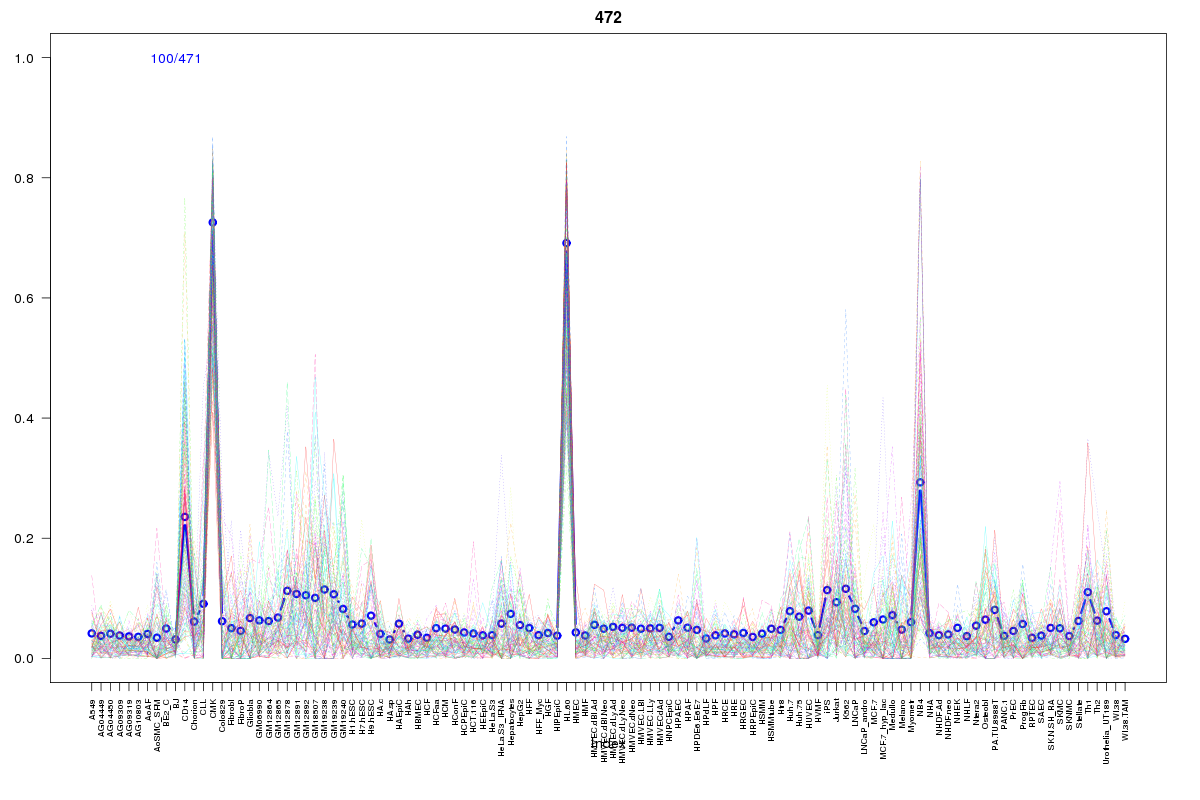 | 472 | 1 |
 | 10 | 1 |
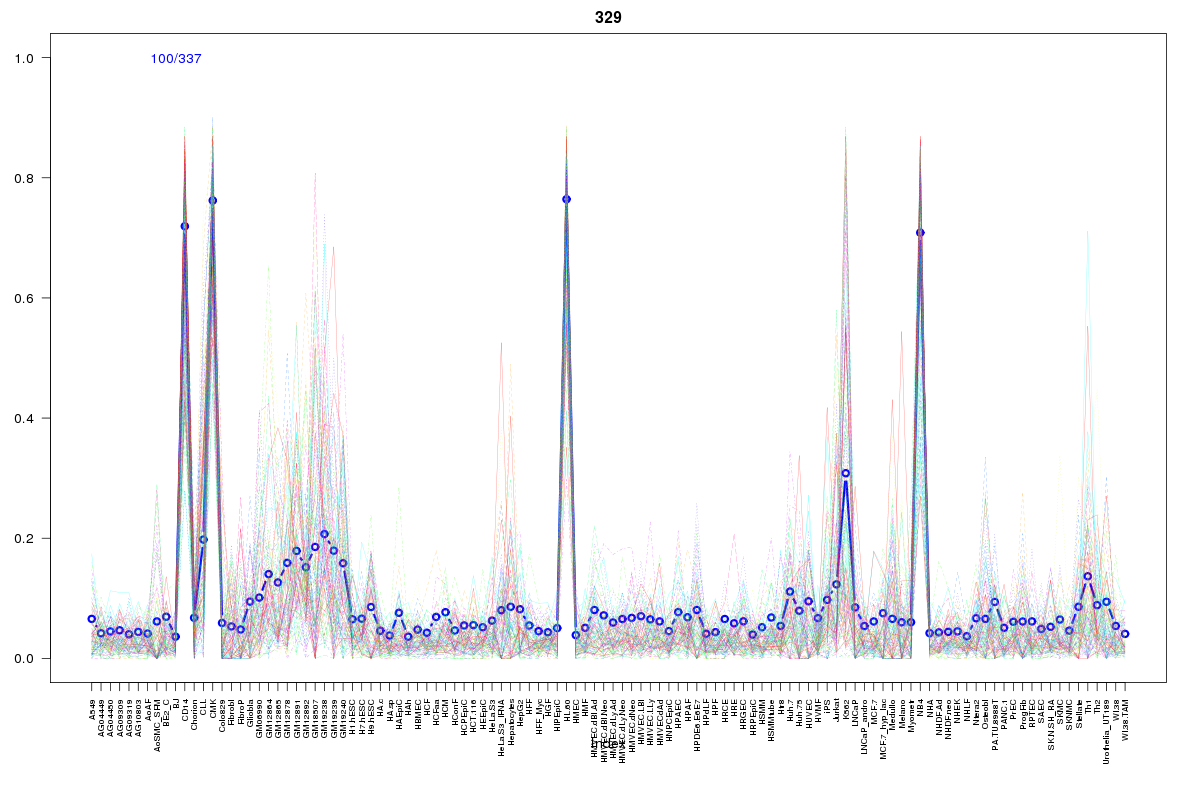 | 329 | 1 |
Resources
BED file downloads
Connects to 13 DHS sitesTop 10 Correlated DHS Sites
p-values indiciate significant higher or lower correlation| Location | Cluster | P-value |
|---|---|---|
| chr10:104315940-104316090 | 1535 | 0.017 |
| chr10:104283460-104283610 | 2352 | 0.018 |
| chr10:104161680-104161830 | 2450 | 0.021 |
| chr10:104353160-104353310 | 1473 | 0.022 |
| chr10:104243785-104243935 | 1208 | 0.024 |
| chr10:104193365-104193515 | 570 | 0.023 |
| chr10:104307760-104307910 | 626 | 0.022 |
| chr10:104298060-104298210 | 626 | 0.019 |
| chr10:104229300-104229450 | 675 | 0.009 |
| chr10:104294200-104294350 | 675 | 0.008 |
| chr10:104214500-104214650 | 10 | 0.003 |
External Databases
UCSCEnsembl (ENSG00000138107)