Gene: ATP8A2
chr13: 25946208-26599989Expression Profile
(log scale)
Graphical Connections
Distribution of linked clusters:
You may find it interesting if many of the connected DHS sites belong to the same cluster.| Cluster Profile | Cluster ID | Number of DHS sites in this cluster |
|---|---|---|
 | 862 | 11 |
 | 10 | 5 |
 | 1605 | 2 |
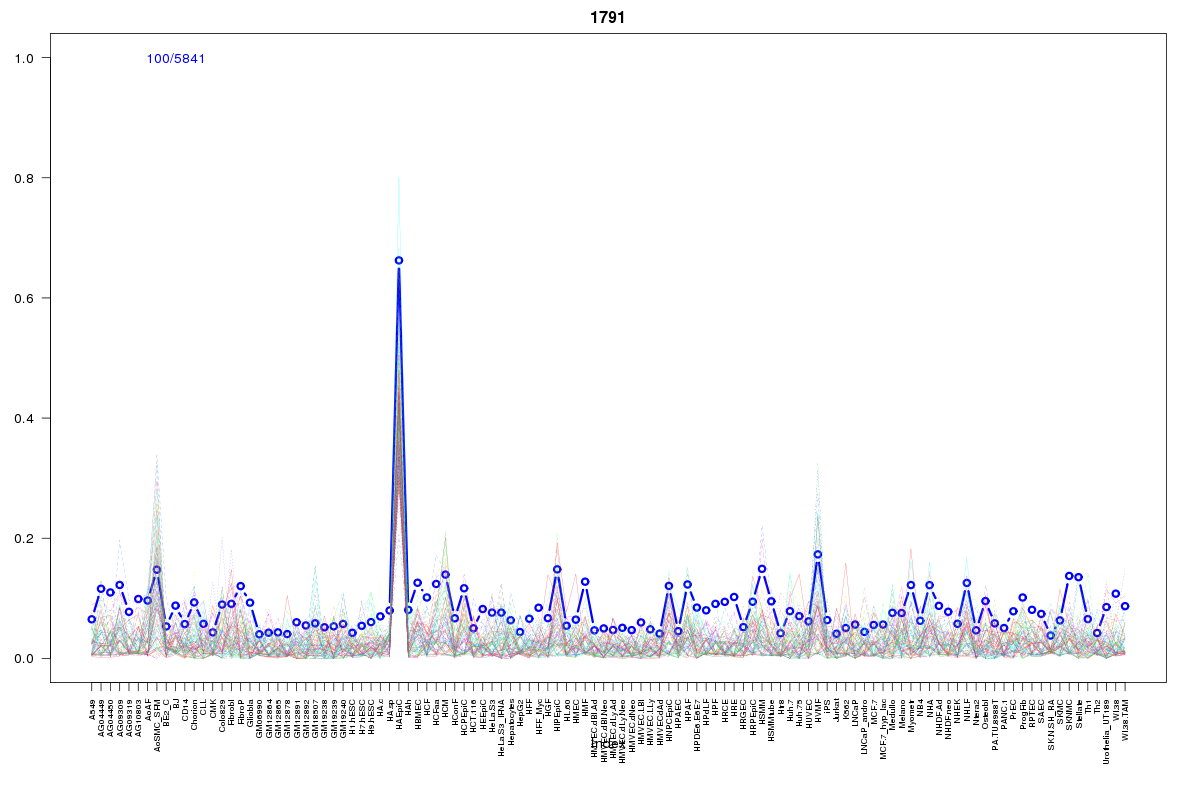 | 1791 | 2 |
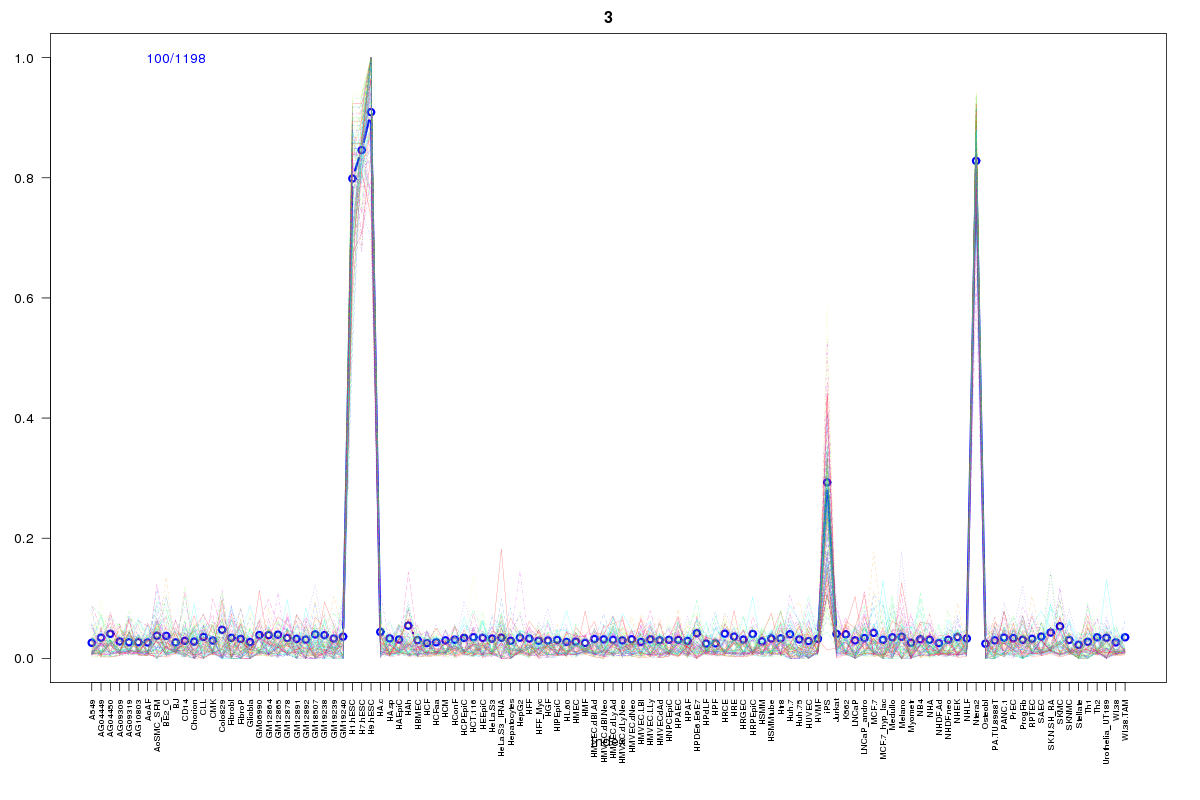 | 3 | 2 |
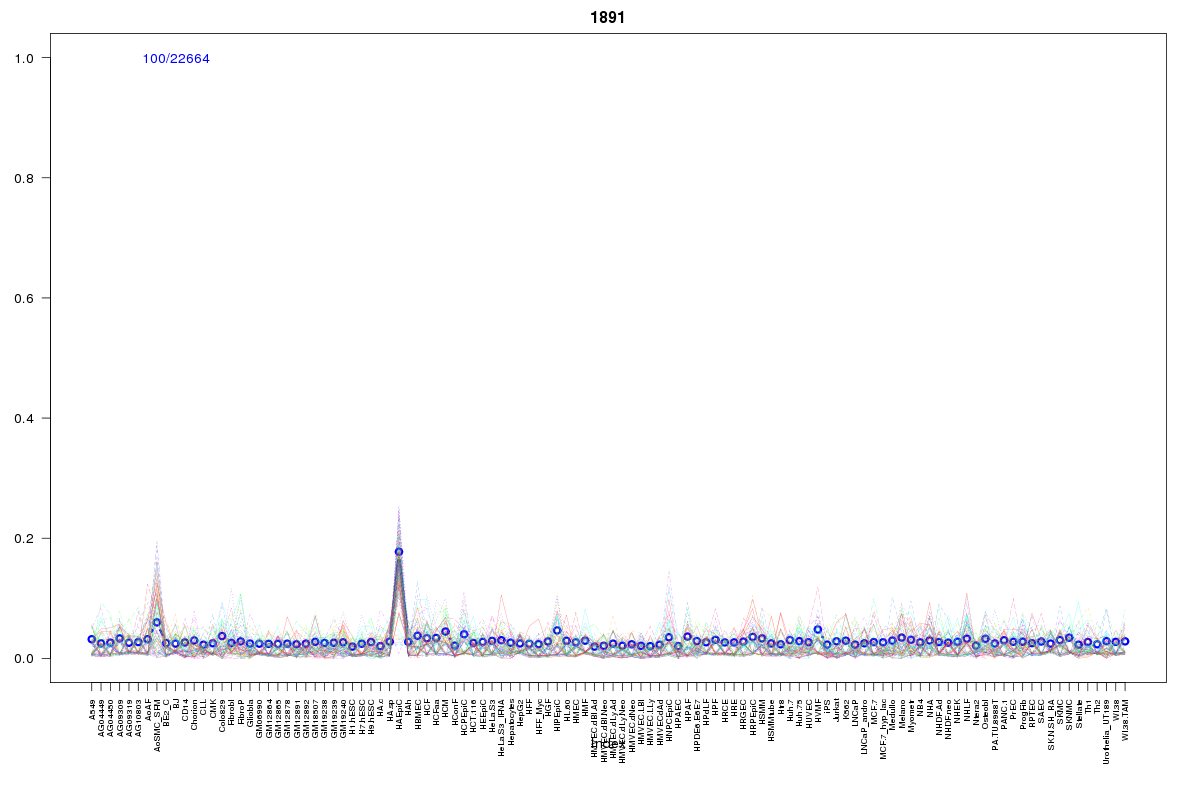 | 1891 | 2 |
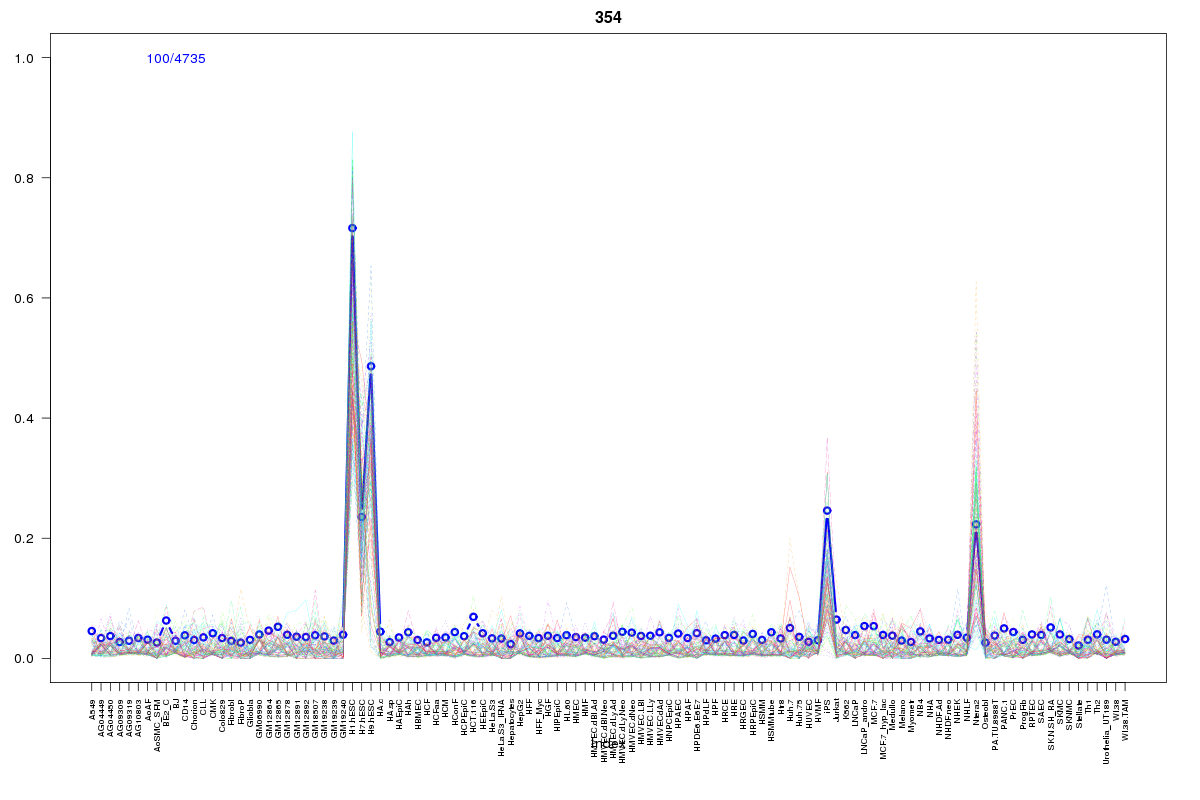 | 354 | 2 |
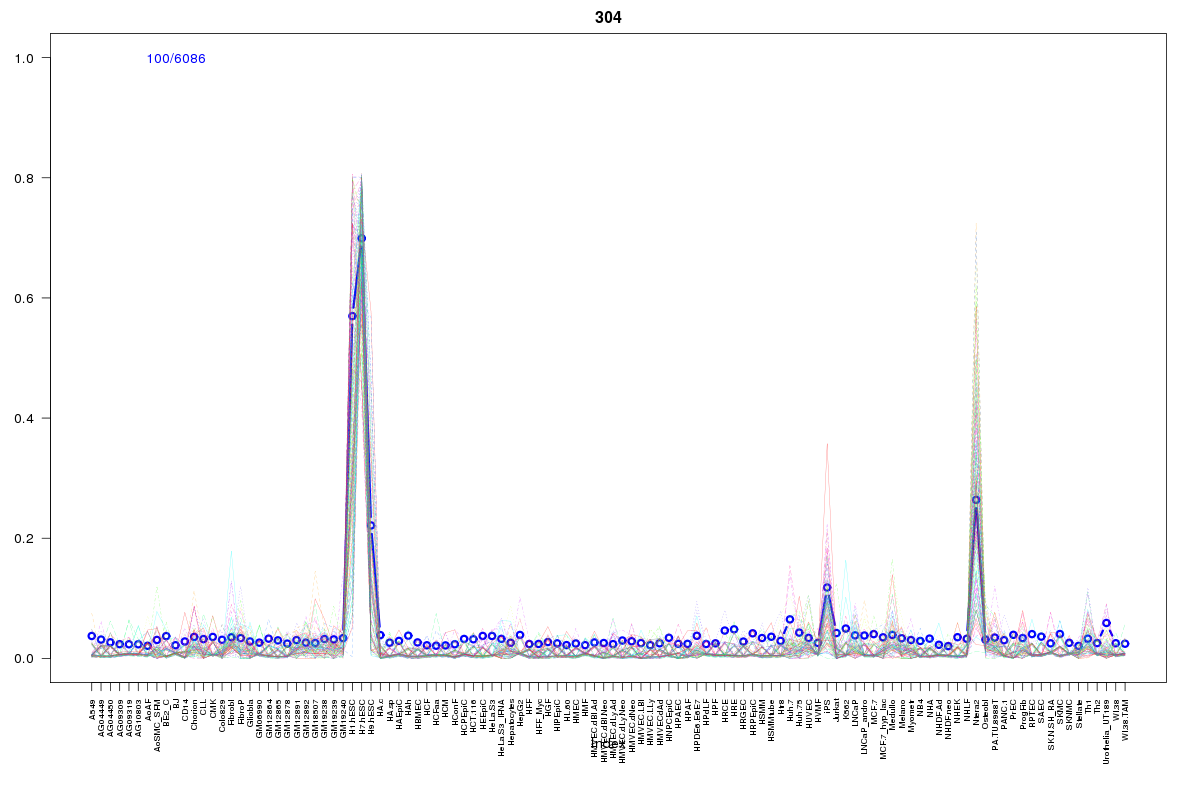 | 304 | 2 |
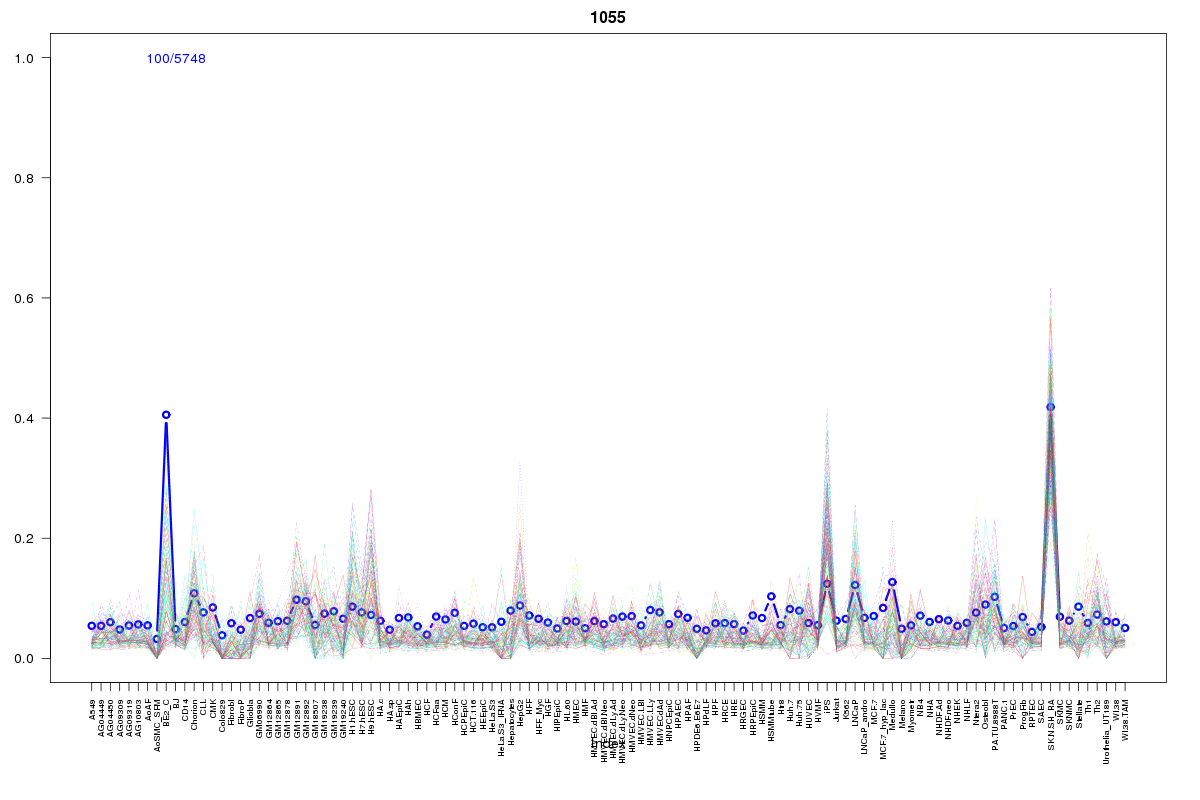 | 1055 | 2 |
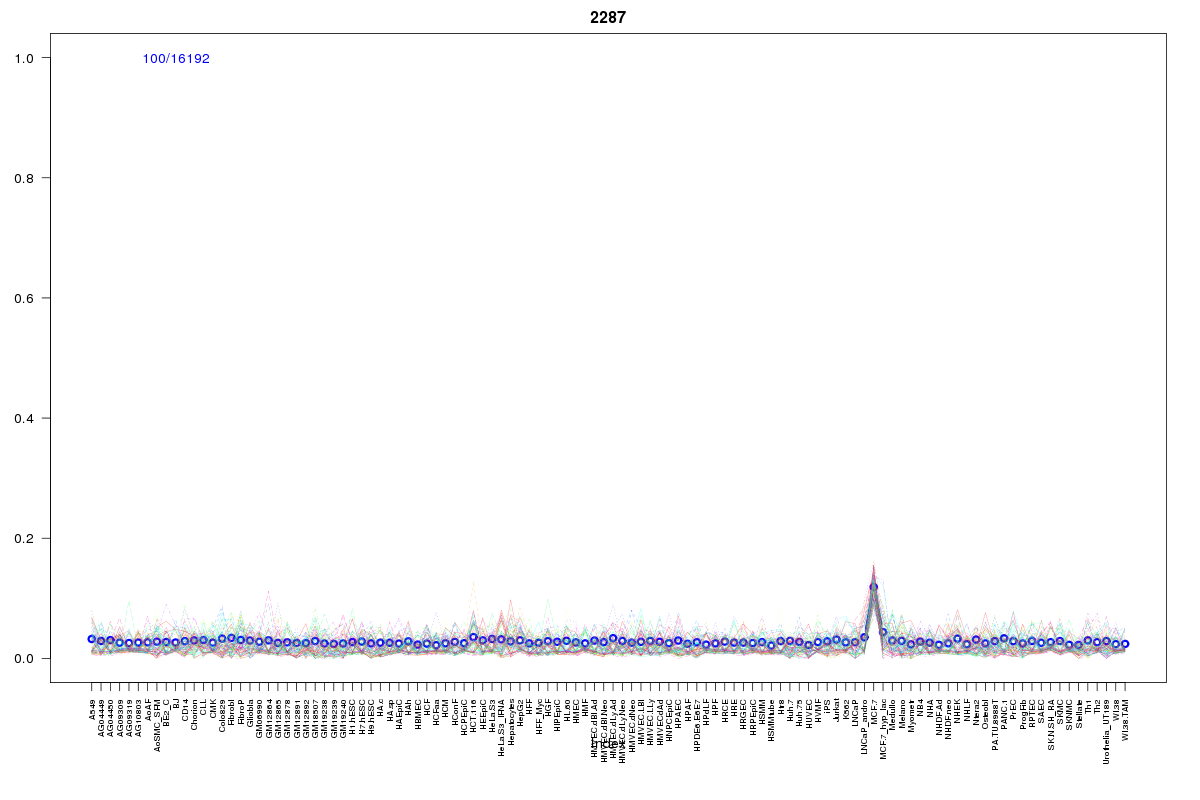 | 2287 | 1 |
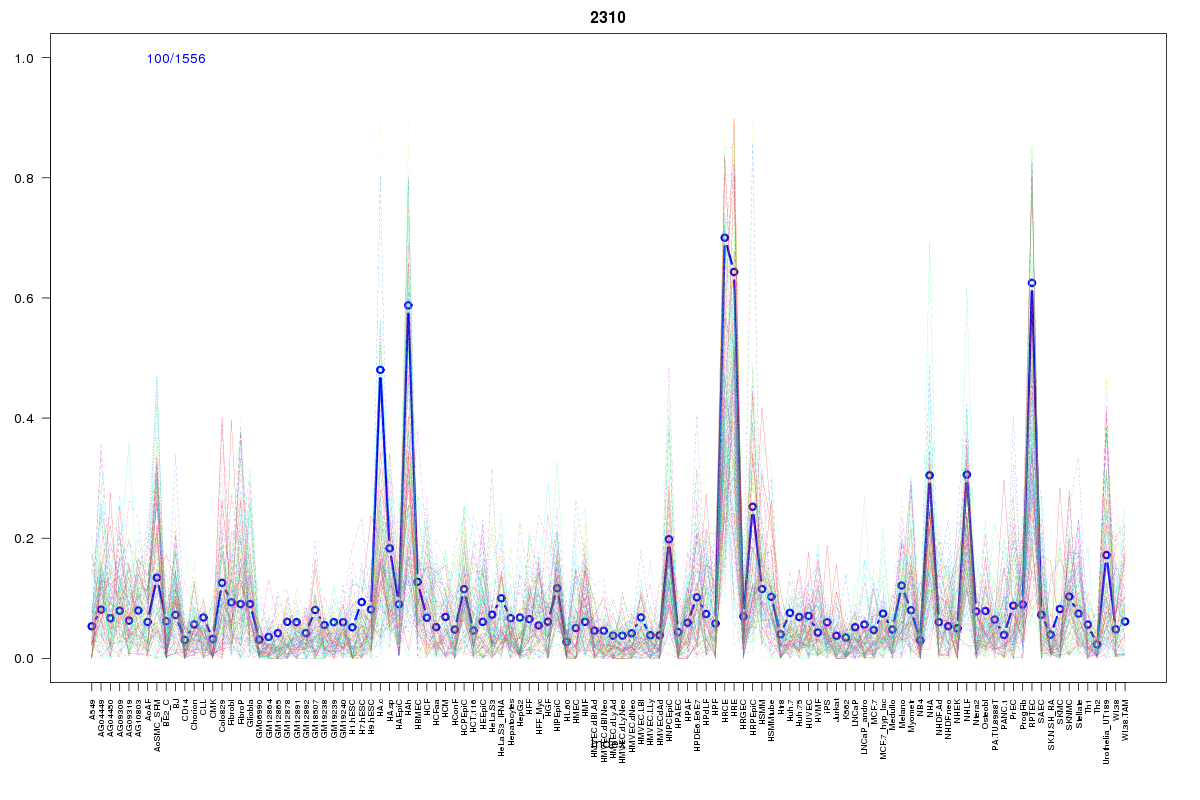 | 2310 | 1 |
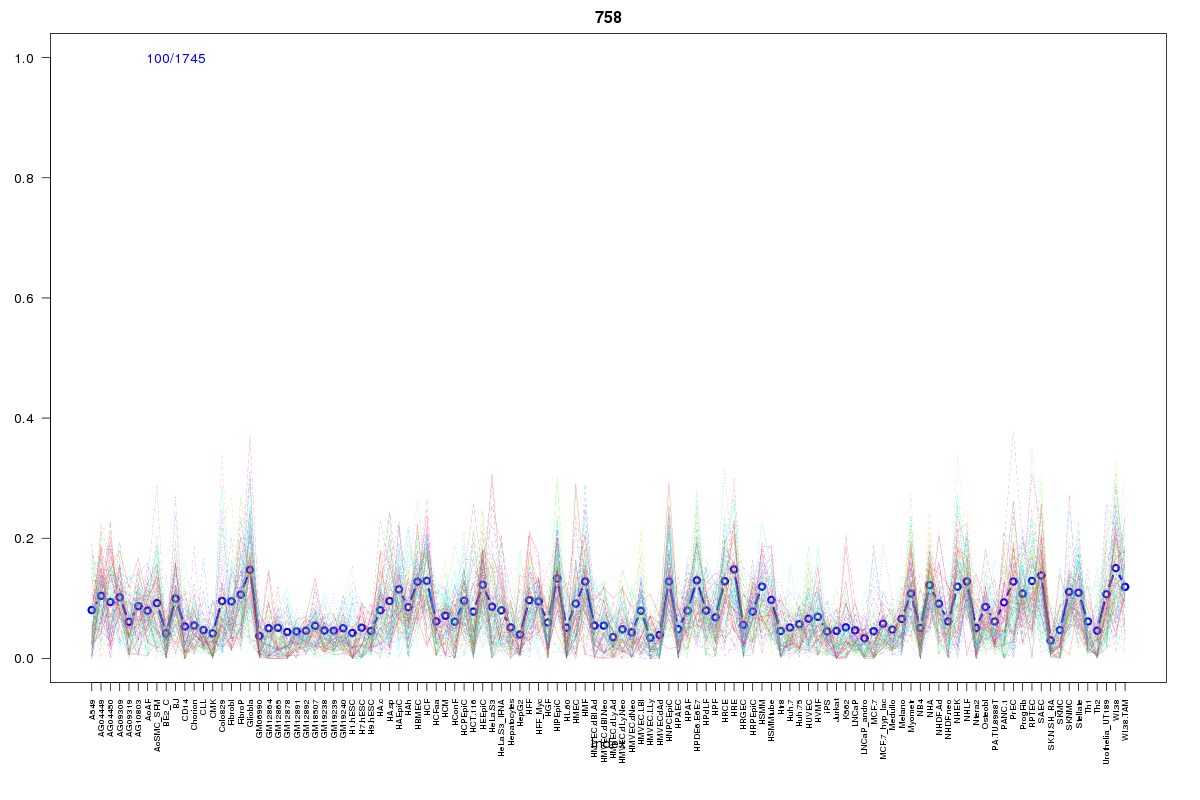 | 758 | 1 |
 | 312 | 1 |
 | 2055 | 1 |
 | 110 | 1 |
 | 927 | 1 |
 | 1008 | 1 |
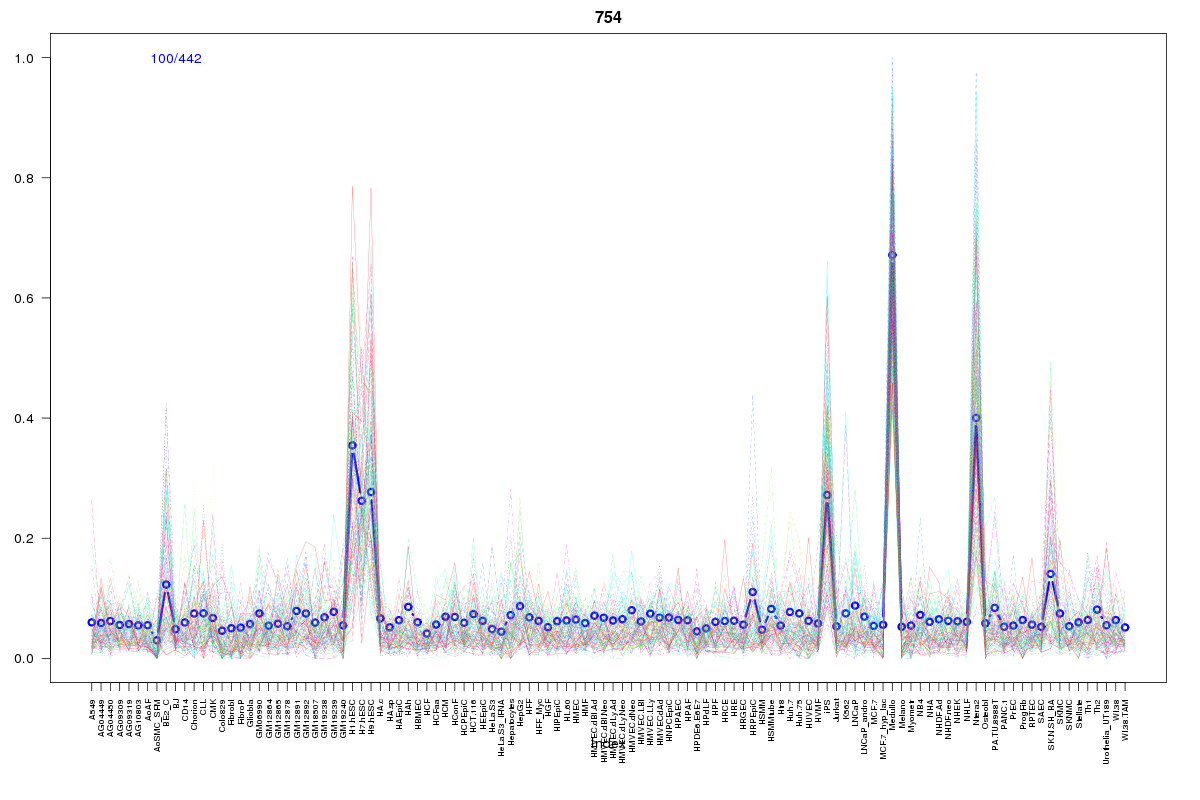 | 754 | 1 |
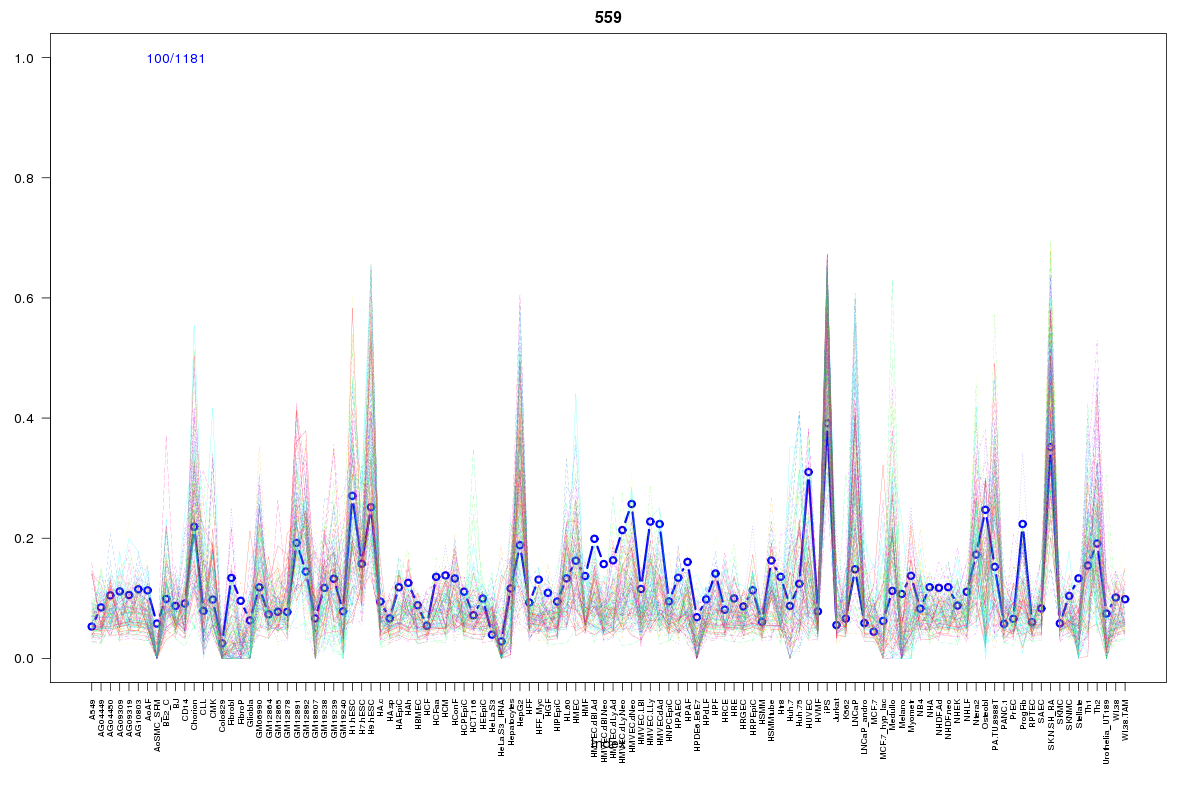 | 559 | 1 |
 | 952 | 1 |
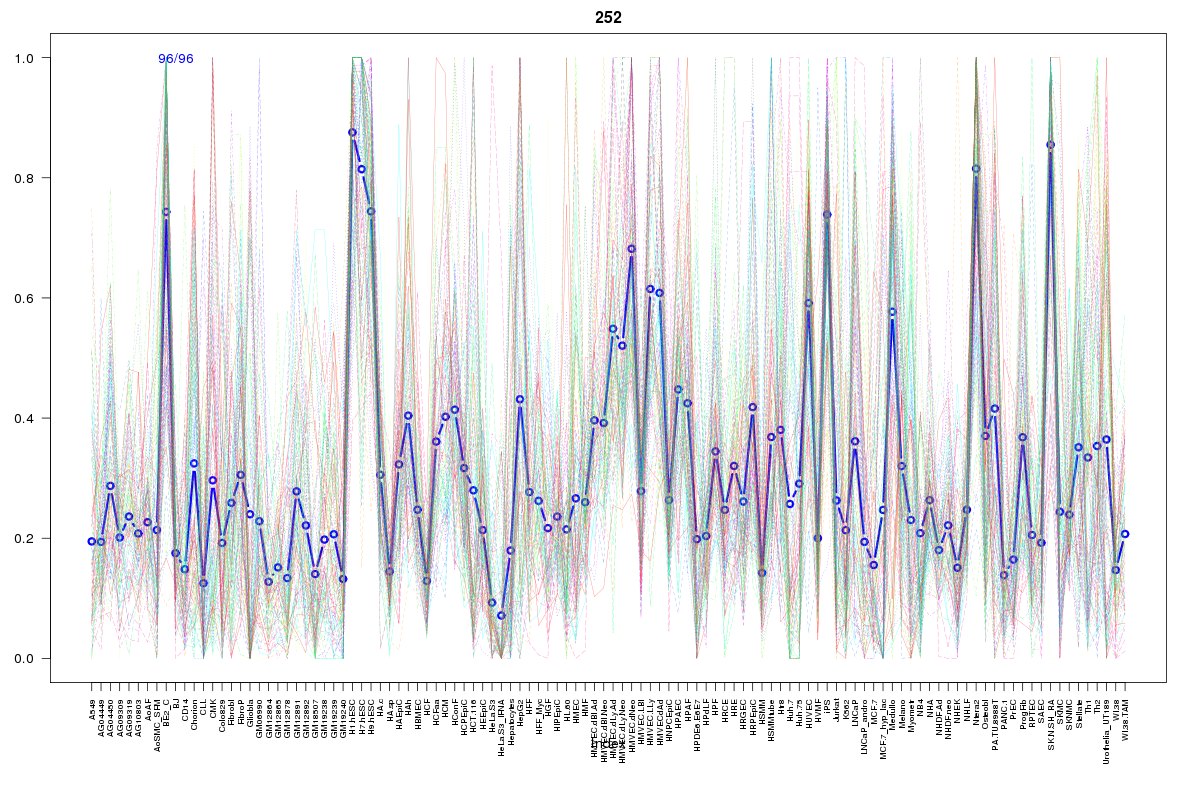 | 252 | 1 |
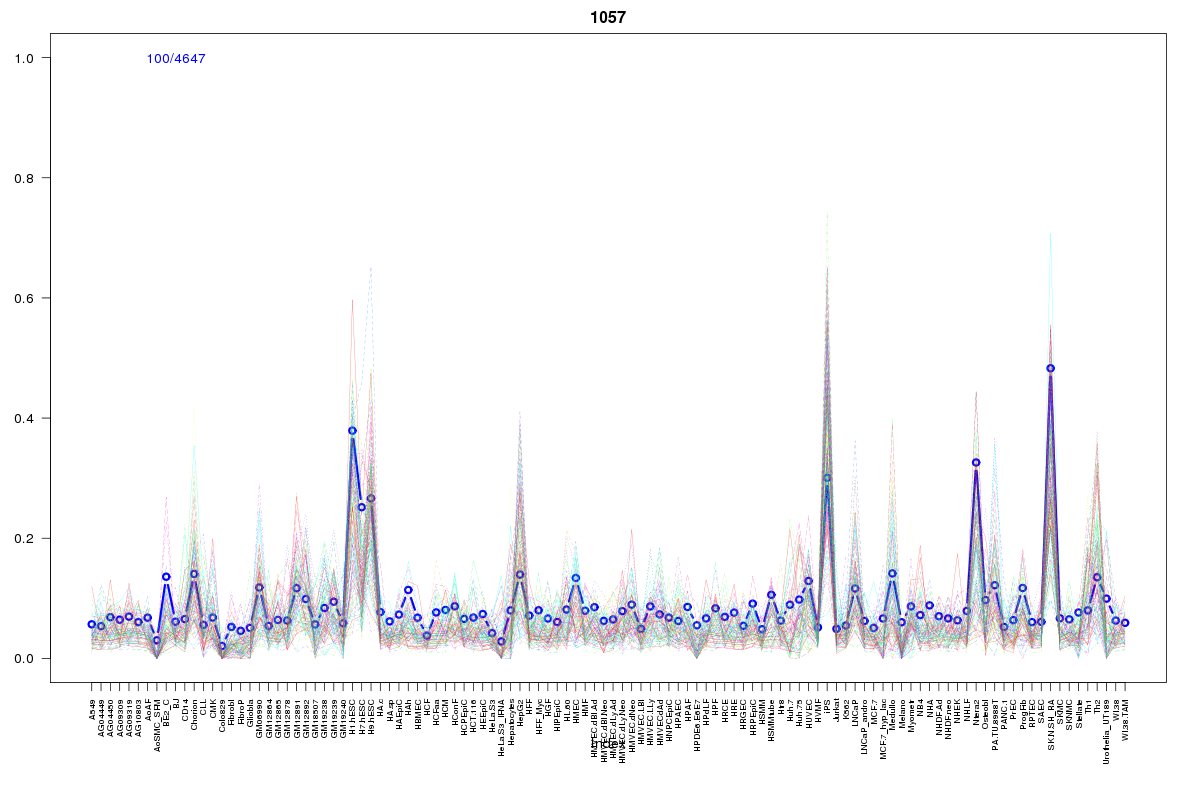 | 1057 | 1 |
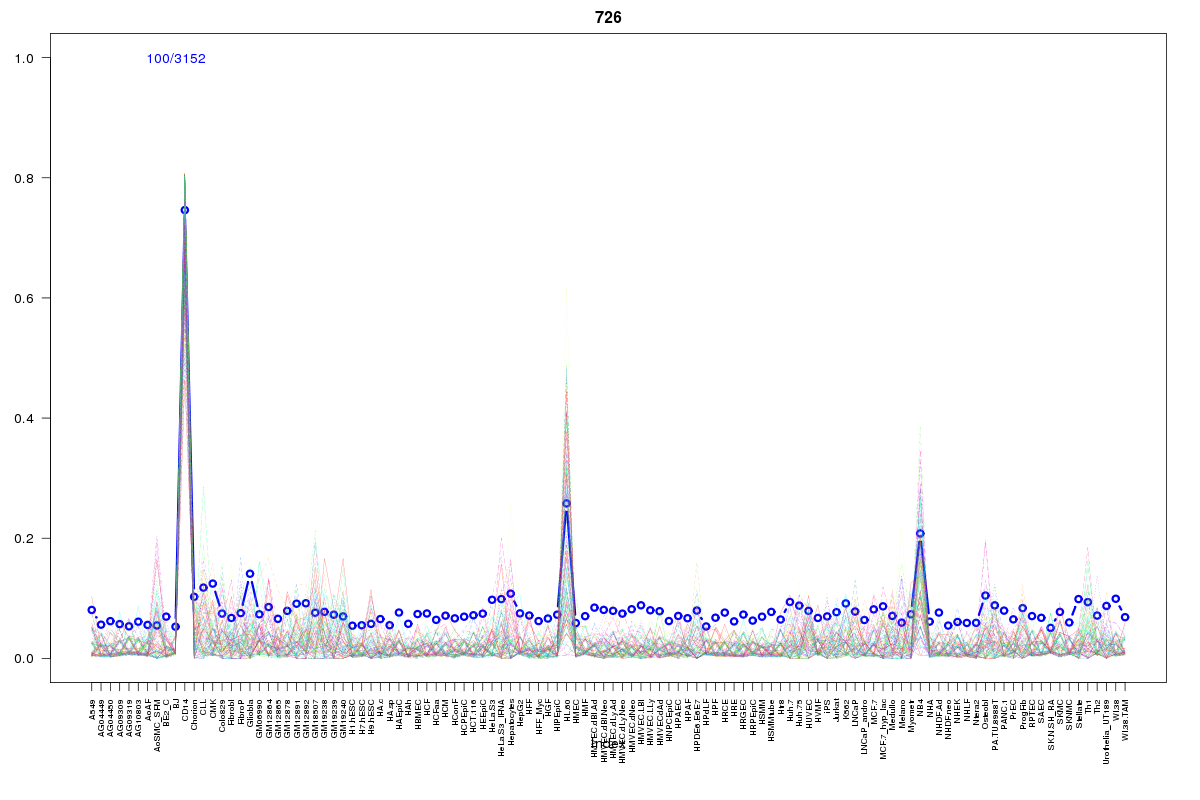 | 726 | 1 |
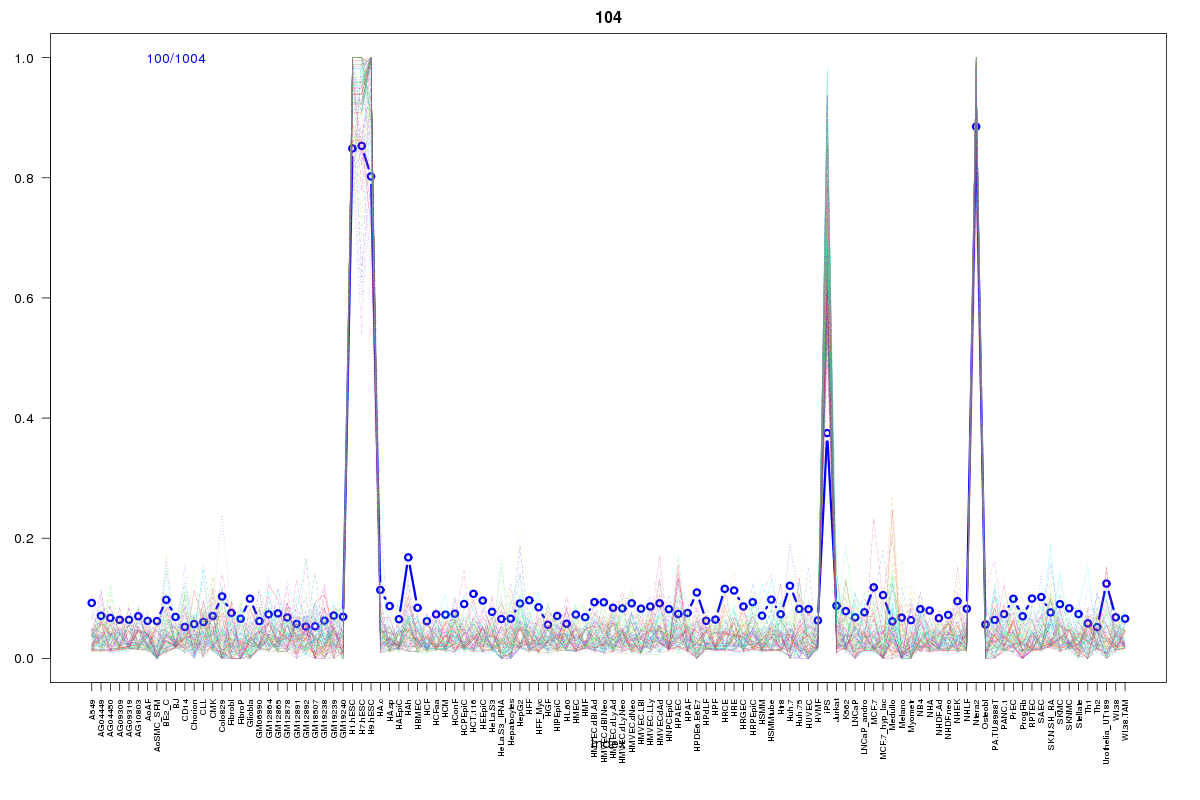 | 104 | 1 |
 | 1177 | 1 |
 | 860 | 1 |
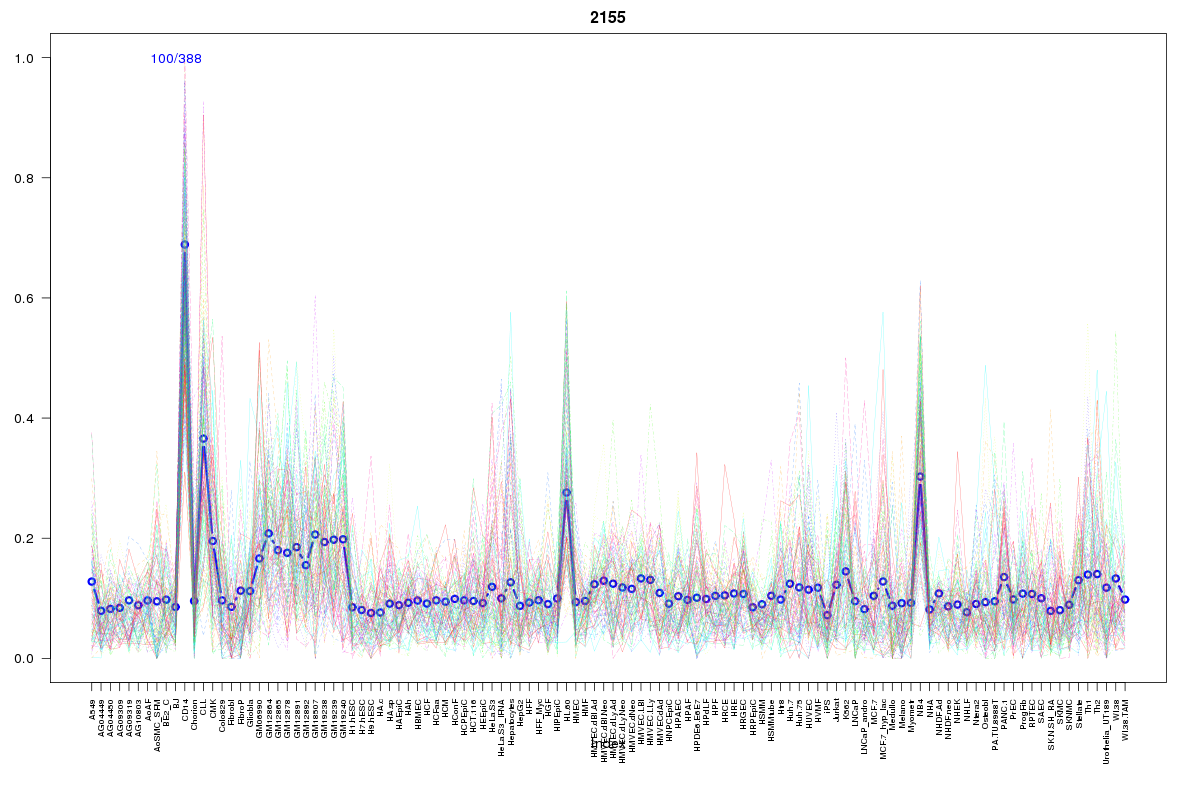 | 2155 | 1 |
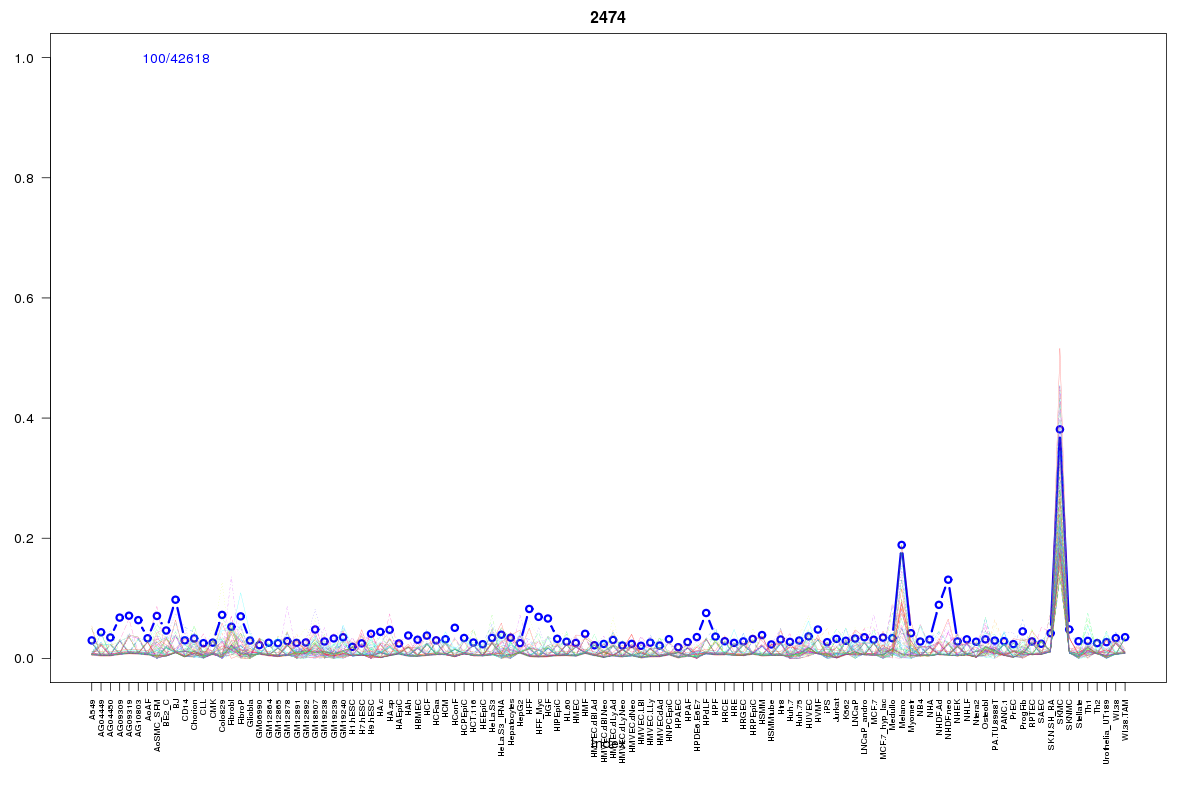 | 2474 | 1 |
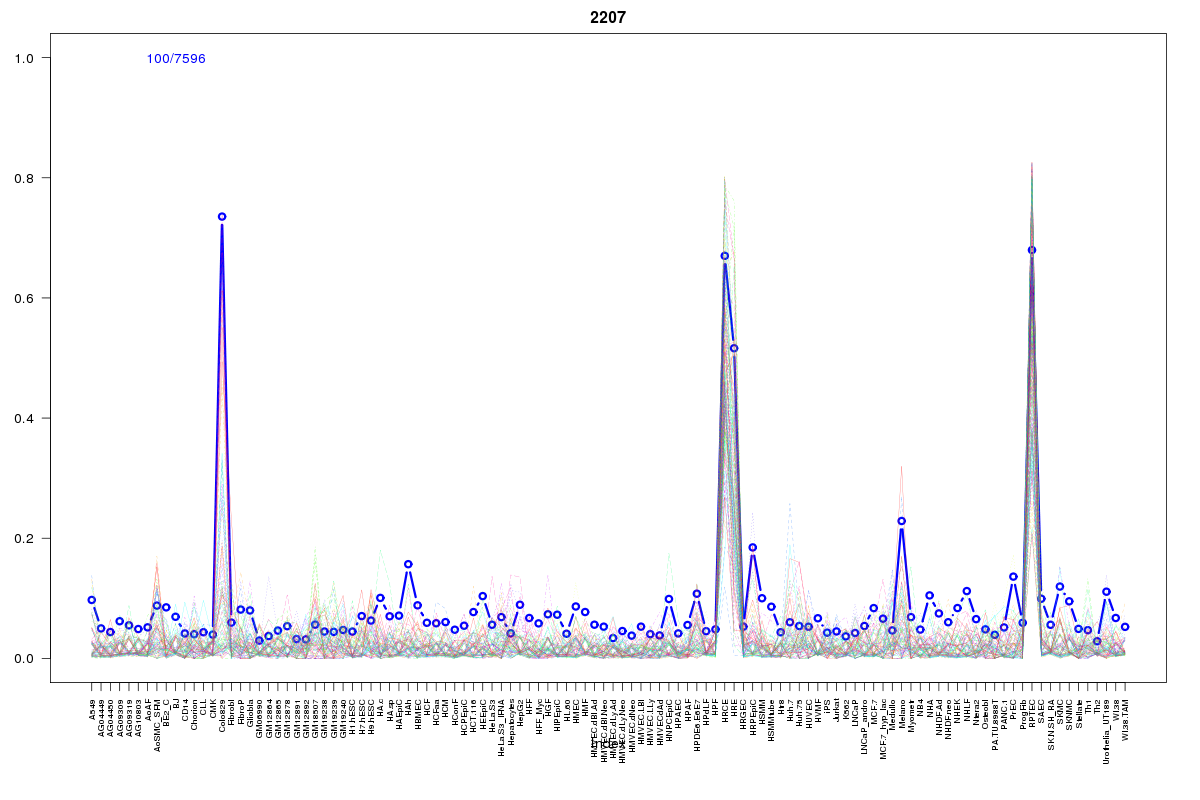 | 2207 | 1 |
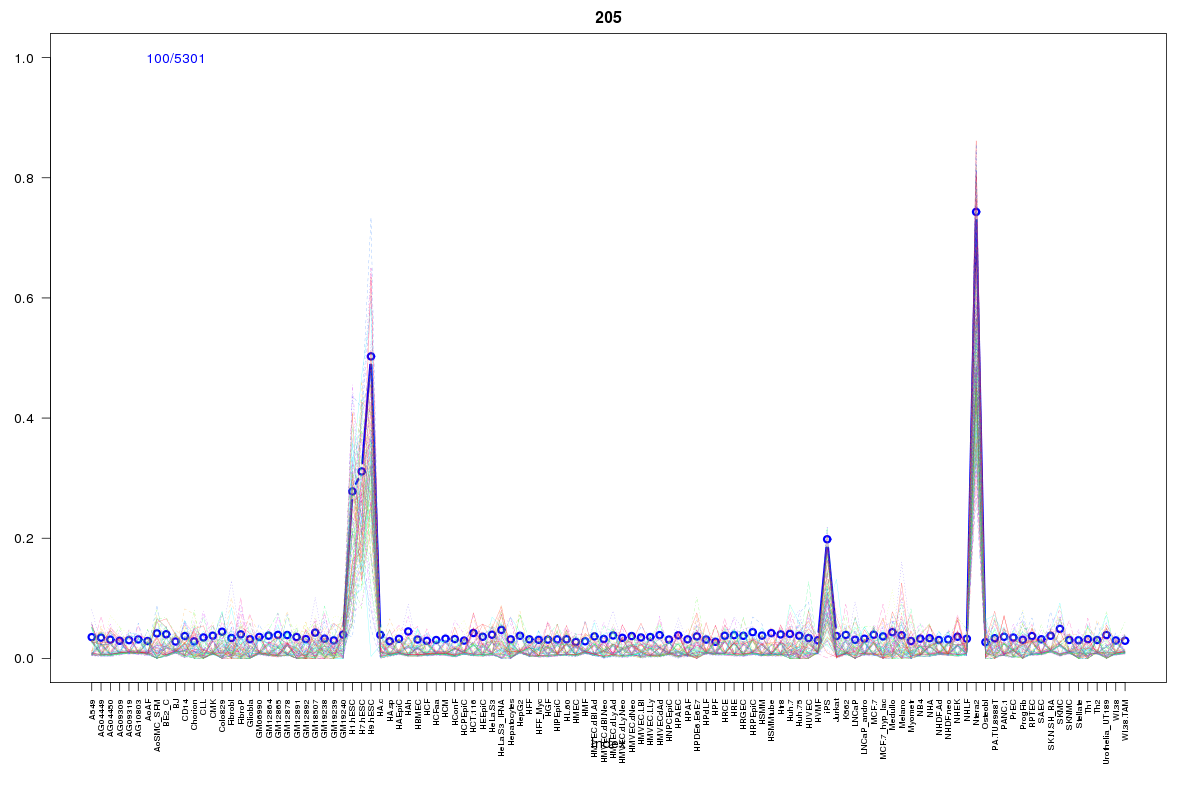 | 205 | 1 |
Resources
BED file downloads
Connects to 51 DHS sitesTop 10 Correlated DHS Sites
p-values indiciate significant higher or lower correlationExternal Databases
UCSCEnsembl (ENSG00000132932)