SOM cluster: 2155
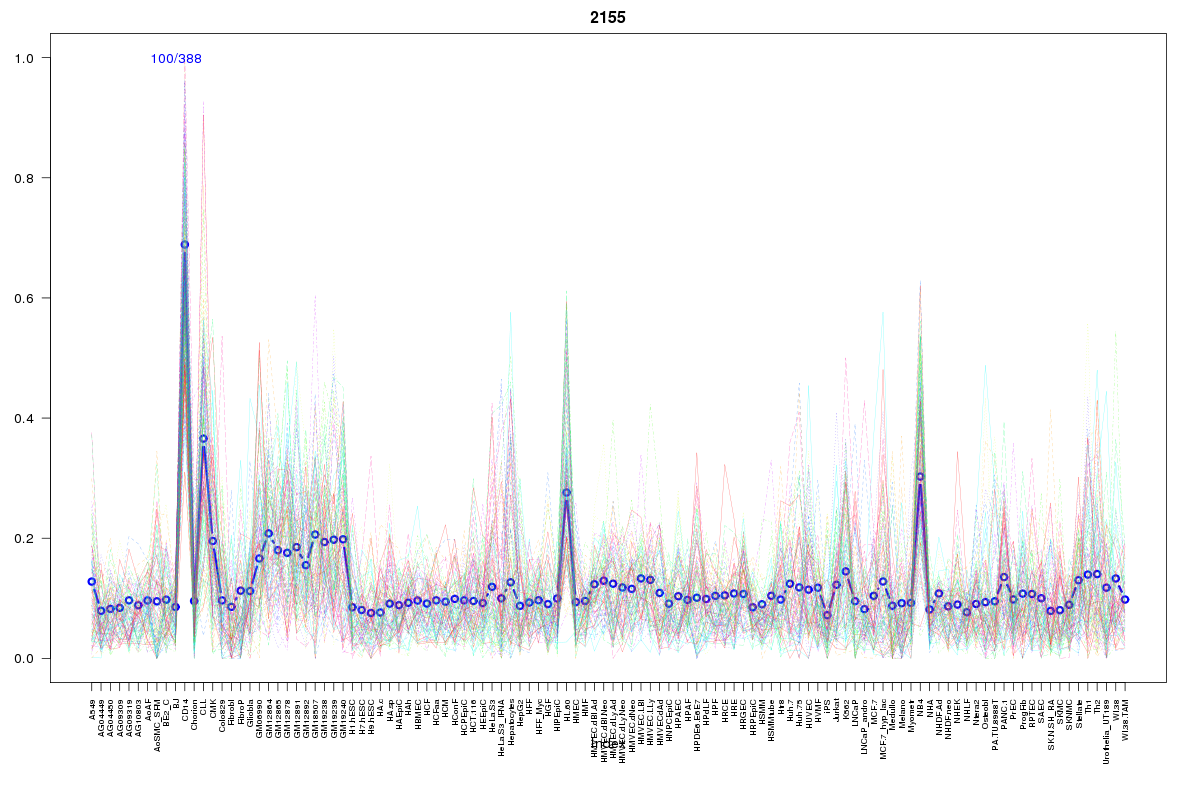
Cluster Hypersensitivity Profile

Genomic Location Trend
These plots show the distribution of the DHS sites surrounding the Transcript Start Site of the nearest gene.
Stats
Number of sites: 388Promoter: 28%
CpG-Island: 5%
Conserved: 27%
Enriched Motifs & Matches
Match Detail: [Jaspar]
|
| ||
|---|---|---|
| Sites: 46/100 | e-val: 1.9e-26 | ||
| Factor | e-val(match) | DB |
| SPI1 | 0.0000000024597 | JASPAR |
| SPIB | 0.000000068939 | JASPAR |
| FEV | 0.0000013123 | JASPAR |
| ELF5 | 0.0000096633 | JASPAR |
| ELK4 | 0.0001797 | JASPAR |
BED file downloads
Top 10 Example Regions
| Location | Gene Link | Dist. |
|---|---|---|
| chr1: 26633540-26633690 | UBXN11 | 35.98 |
| chr13: 30423460-30423610 | LINC00572 | 53.67 |
| chr1: 226594100-226594250 | snoU13 | 56.63 |
| chr10: 27608805-27608955 | LRRC37A6P | 60.45 |
| chr20: 47339285-47339435 | PREX1 | 60.49 |
| chr2: 85805305-85805455 | VAMP8 | 60.56 |
| chr11: 47428840-47428990 | SPI1 | 60.98 |
| chr11: 47428840-47428990 | MADD | 60.98 |
| chr11: 47428840-47428990 | SLC39A13 | 60.98 |
| chr10: 52177420-52177570 | SGMS1 | 61.48 |