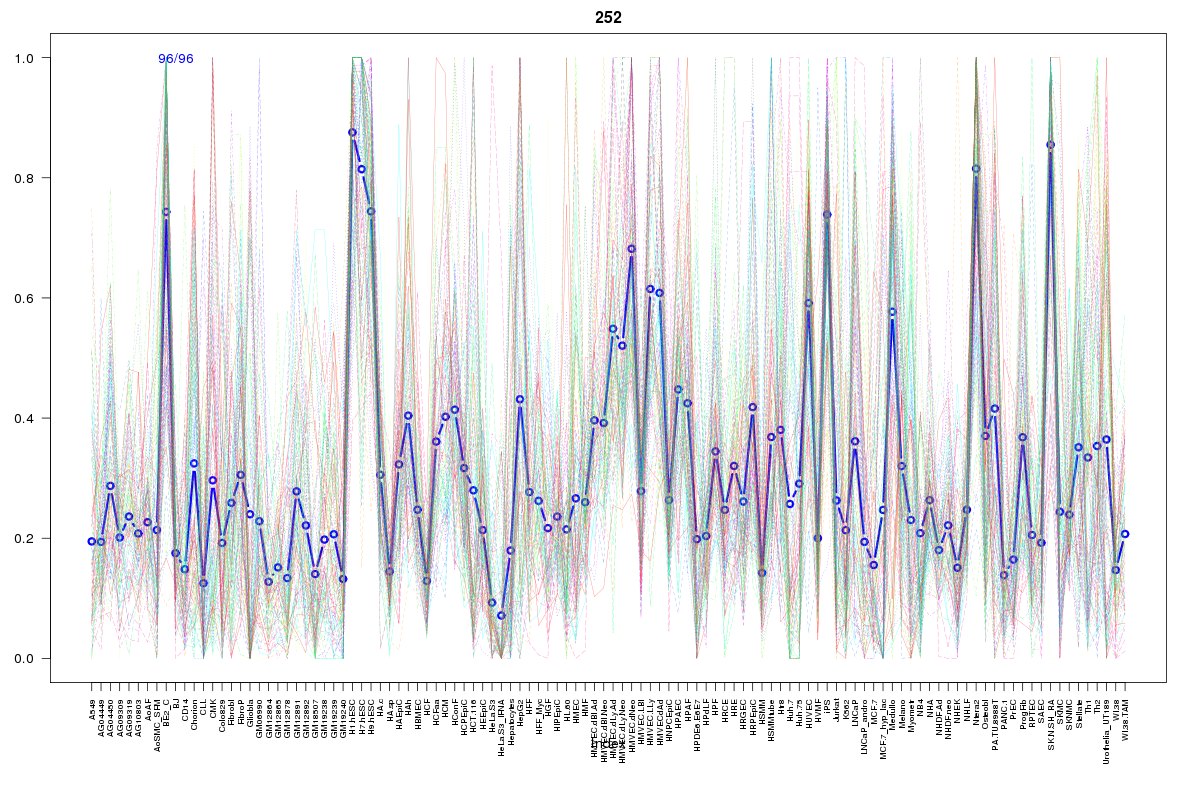
SOM cluster: 252
Cluster Hypersensitivity Profile

Genomic Location Trend
These plots show the distribution of the DHS sites surrounding the Transcript Start Site of the nearest gene.
Stats
Number of sites: 96Promoter: 41%
CpG-Island: 69%
Conserved: 76%
Enriched Motifs & Matches
Match Detail: [Jaspar]
|
| ||
|---|---|---|
| Sites: 95/96 | e-val: 0 | ||
| Factor | e-val(match) | DB |
| SP1 | 0.000049777 | JASPAR |
| Klf4 | 0.0027654 | JASPAR |
| Egr1 | 0.011715 | JASPAR |
| TFAP2A | 0.017712 | JASPAR |
| CTCF | 0.038364 | JASPAR |
|
| ||
| Sites: 66/96 | e-val: 5.2e-25 | ||
| Factor | e-val(match) | DB |
| SP1 | 0.000000000030947 | JASPAR |
| Pax4 | 0.00014937 | JASPAR |
| RREB1 | 0.00043259 | JASPAR |
| PLAG1 | 0.00048717 | JASPAR |
| TFAP2A | 0.0012049 | JASPAR |
BED file downloads
Top 10 Example Regions
| Location | Gene Link | Dist. |
|---|---|---|
| chr19: 13275260-13275410 | NACC1 | 50.86 |
| chr7: 106685285-106685435 | PRKAR2B | 54.86 |
| chr5: 170288745-170288895 | RANBP17 | 59.42 |
| chr5: 170288745-170288895 | GABRP | 59.42 |
| chr11: 123525480-123525630 | SCN3B | 60.29 |
| chr11: 123525480-123525630 | ZNF202 | 60.29 |
| chr11: 104034960-104035110 | PDGFD | 61.07 |
| chr3: 14257820-14257970 | XPC | 61.84 |
| chr19: 17817640-17817790 | UNC13A | 64.59 |
| chr1: 210424660-210424810 | SERTAD4-AS1 | 66.38 |