Gene: SMARCA2
chr9: 2015341-2193624Expression Profile
(log scale)
Graphical Connections
Distribution of linked clusters:
You may find it interesting if many of the connected DHS sites belong to the same cluster.| Cluster Profile | Cluster ID | Number of DHS sites in this cluster |
|---|---|---|
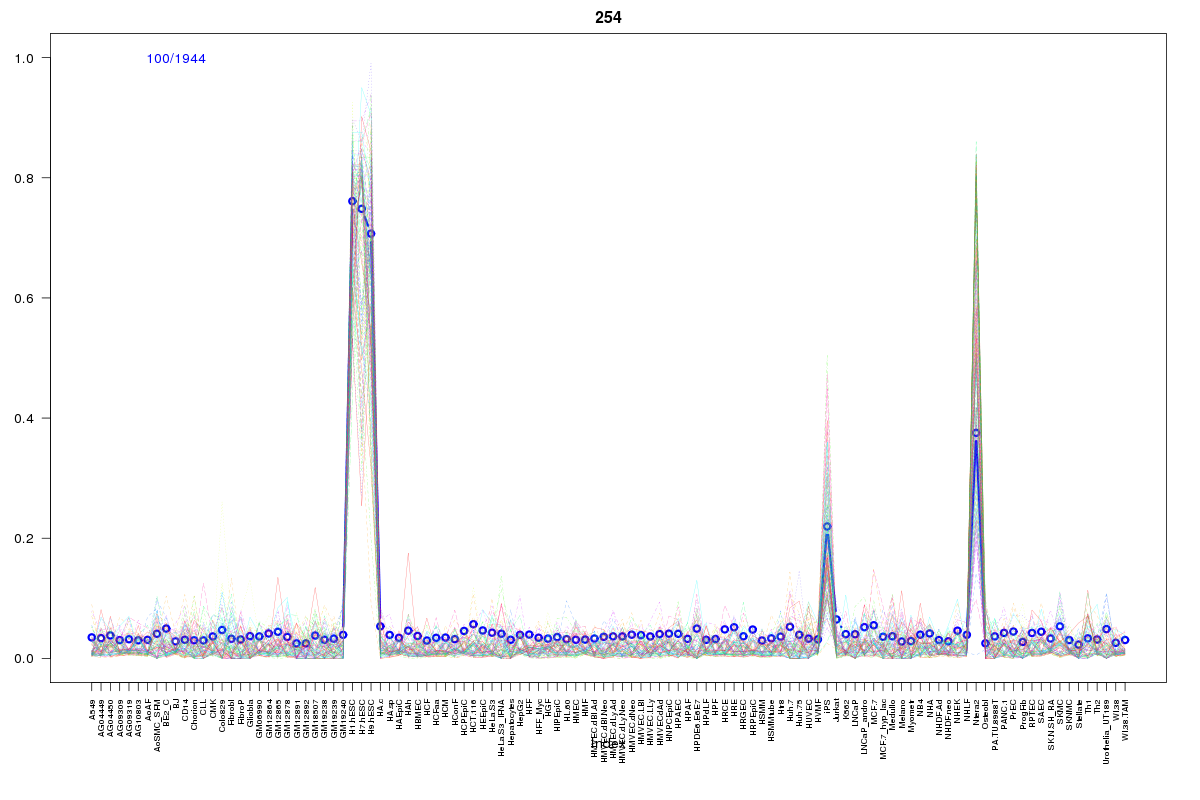 | 254 | 2 |
 | 66 | 2 |
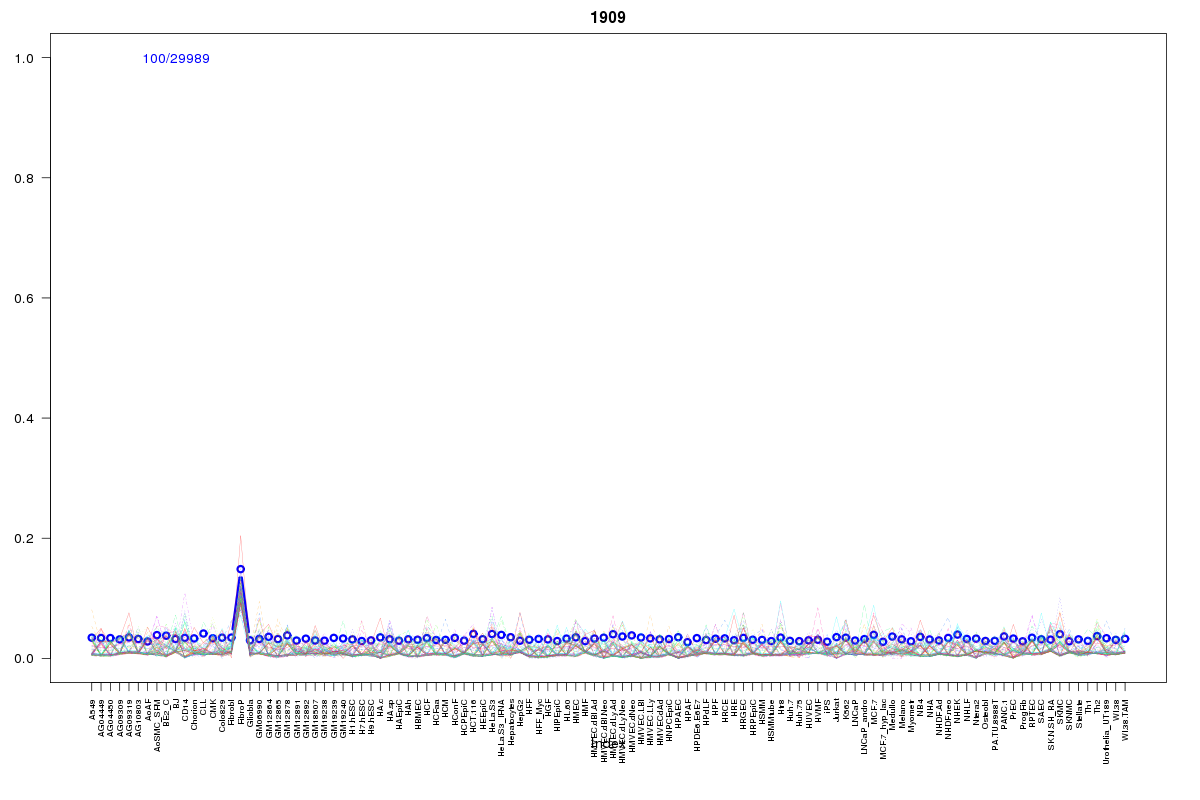 | 1909 | 1 |
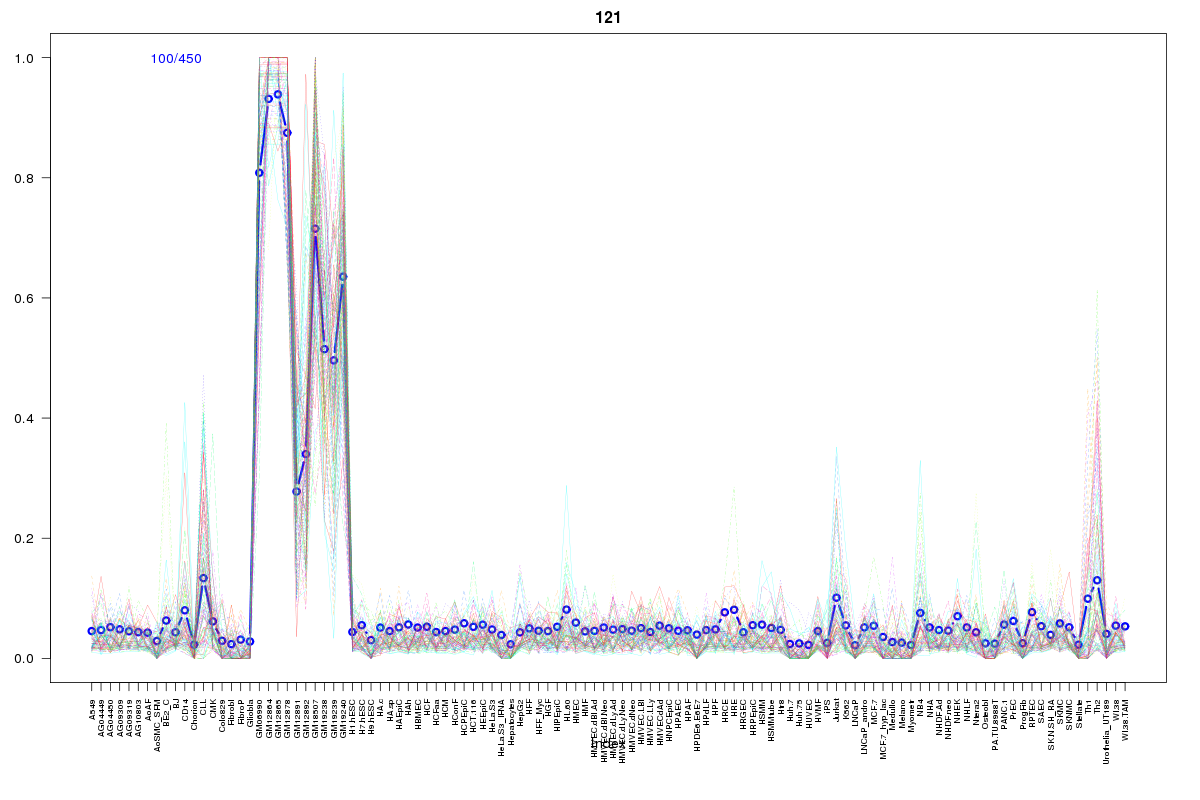 | 121 | 1 |
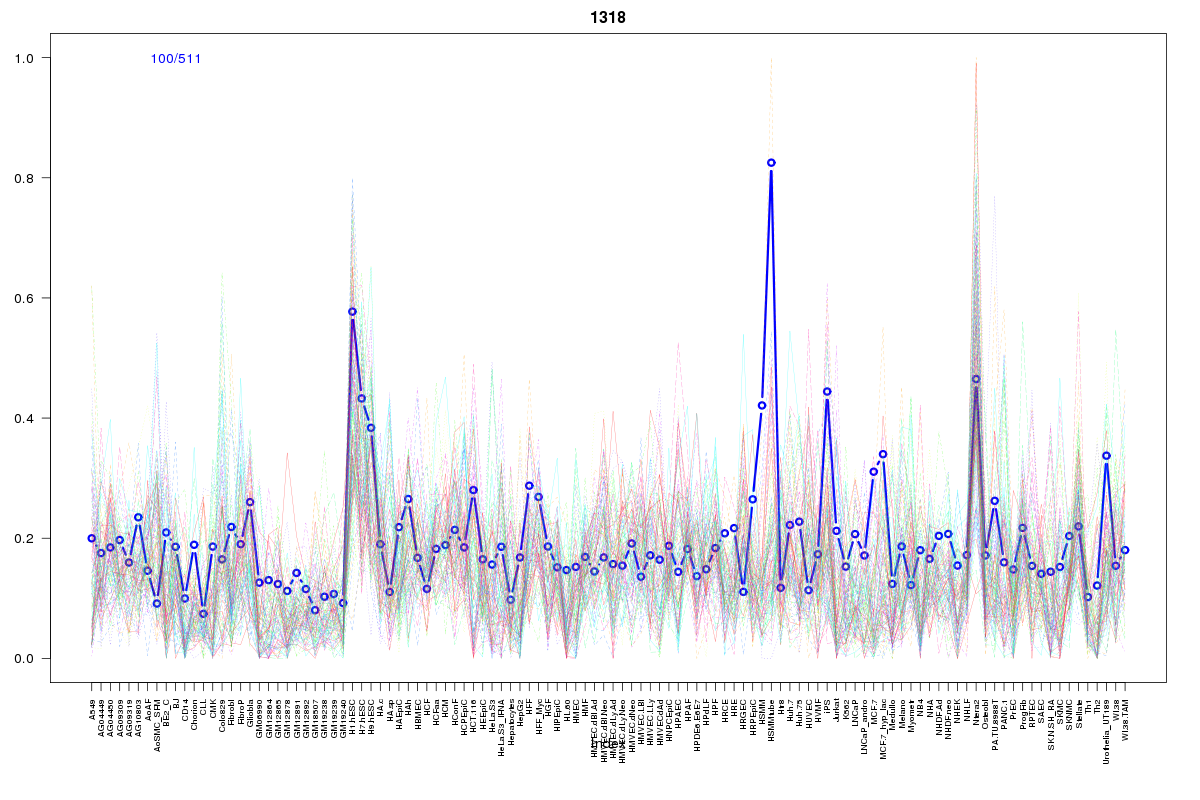 | 1318 | 1 |
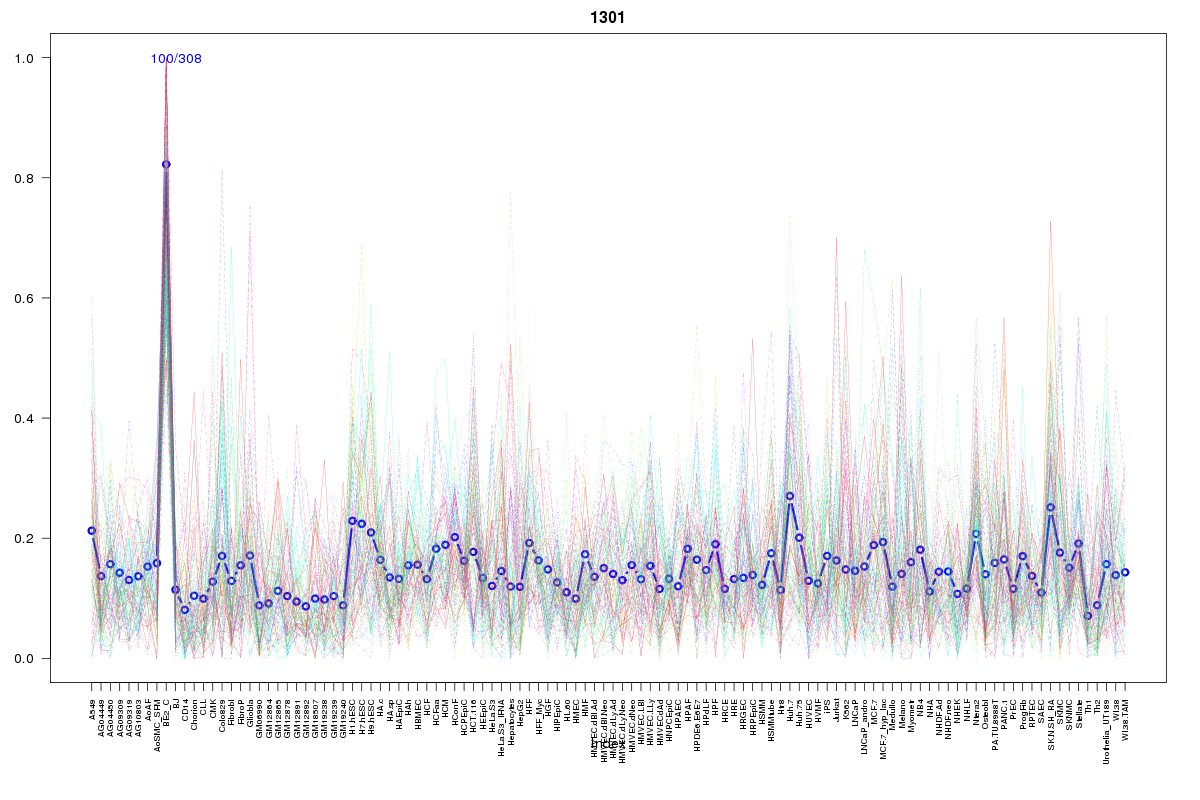 | 1301 | 1 |
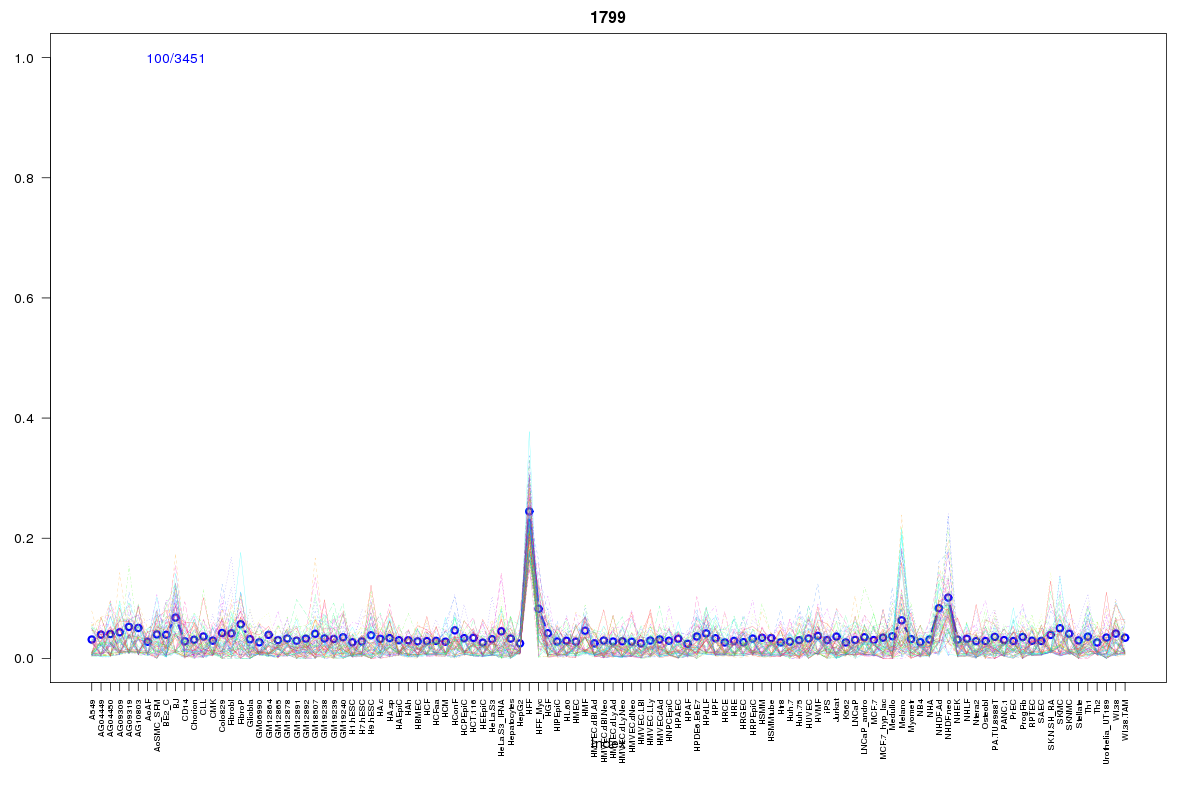 | 1799 | 1 |
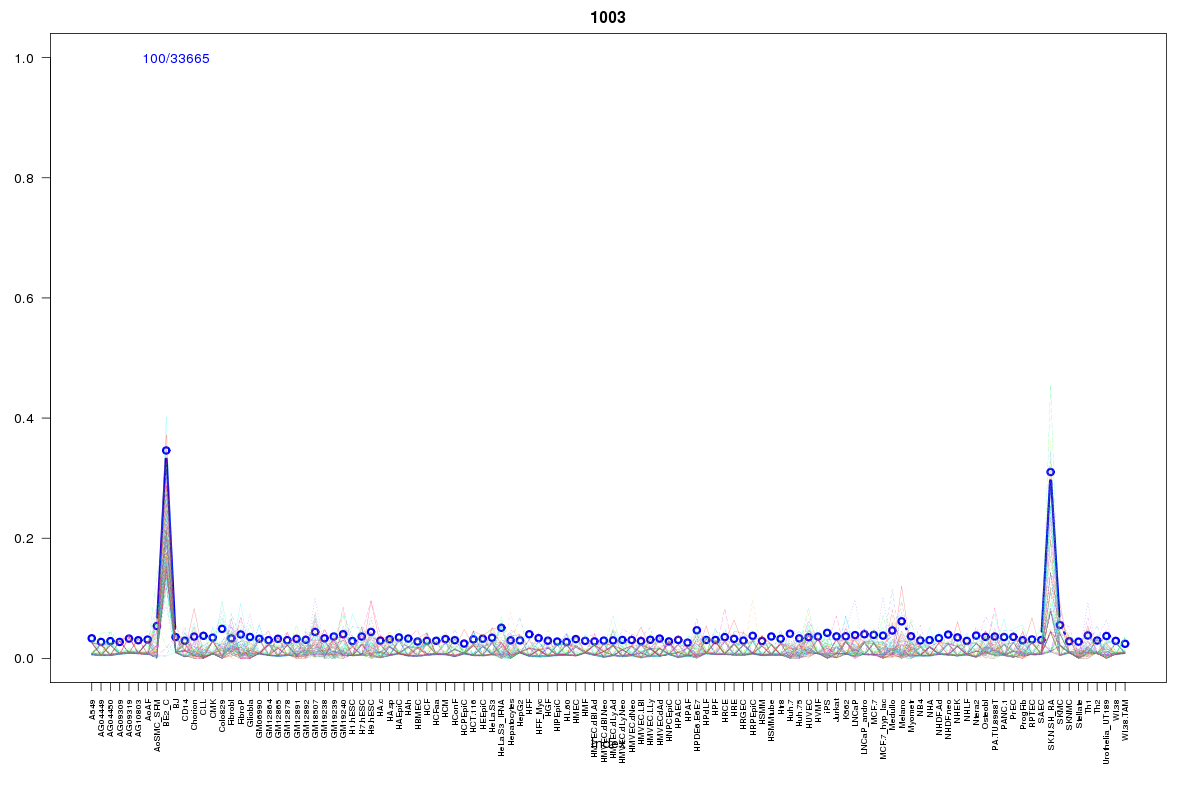 | 1003 | 1 |
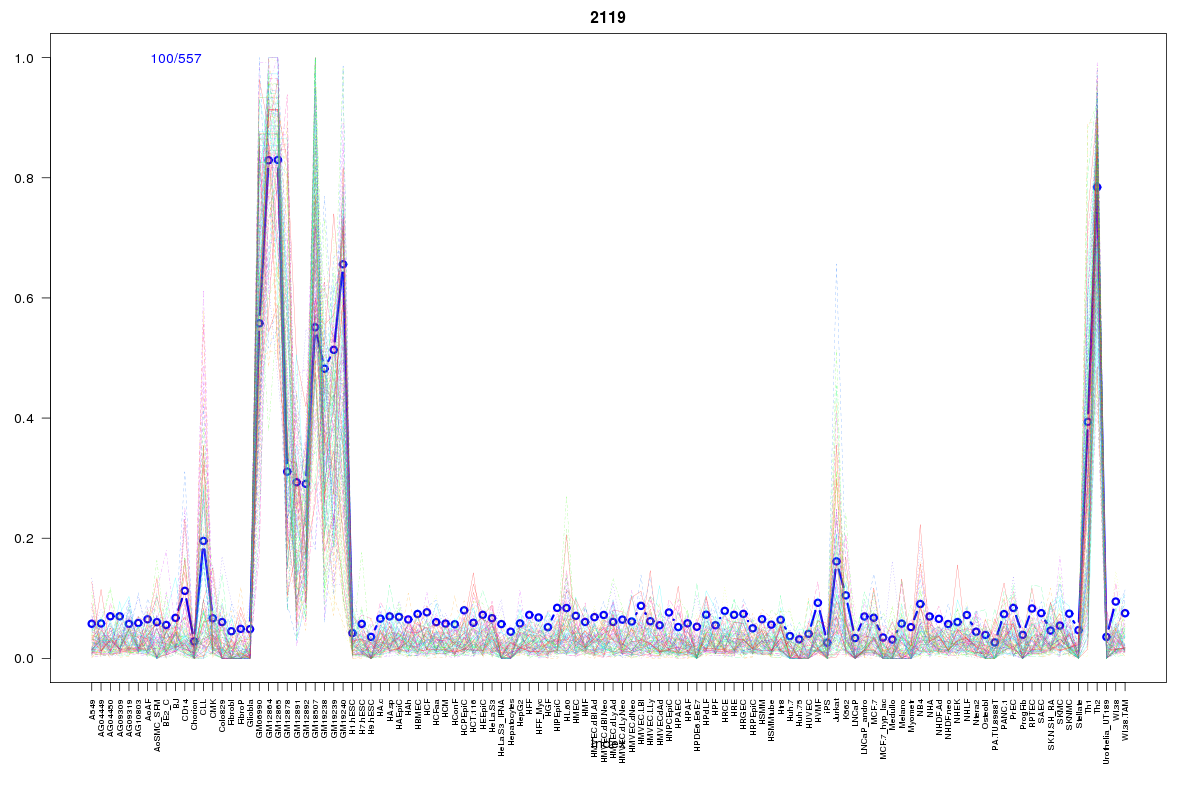 | 2119 | 1 |
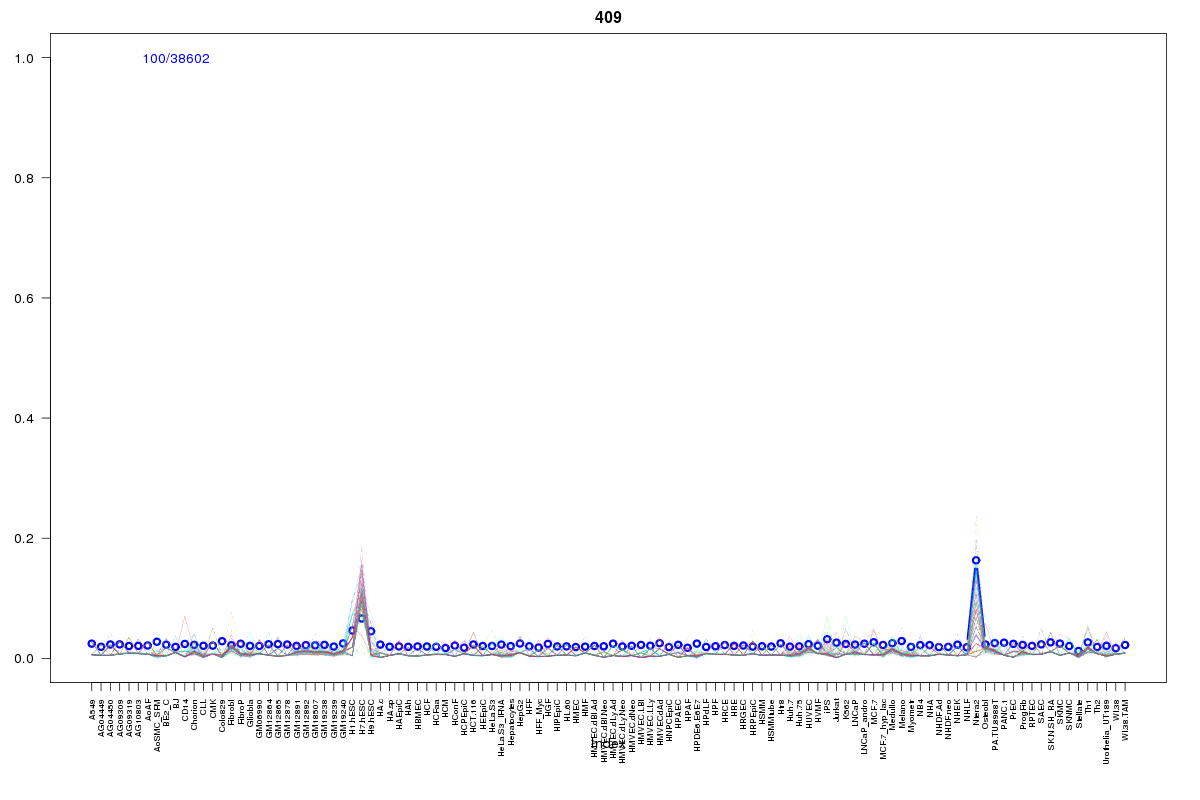 | 409 | 1 |
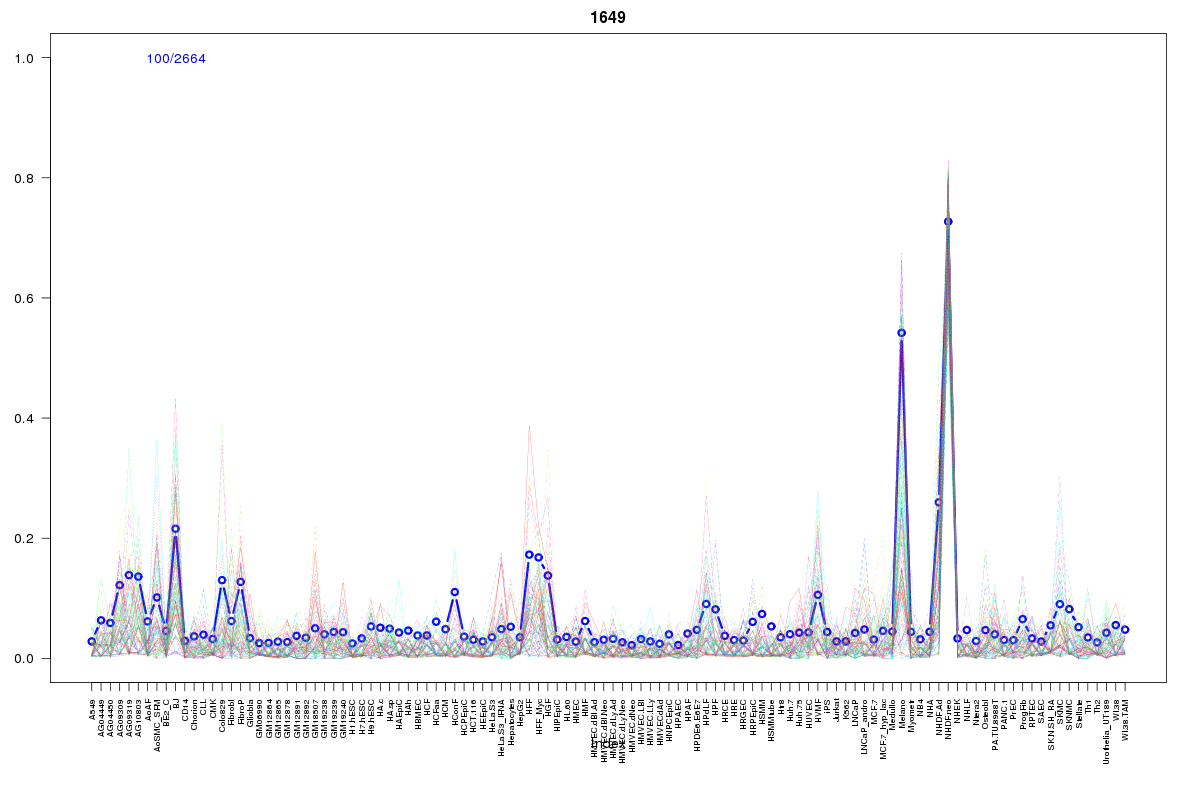 | 1649 | 1 |
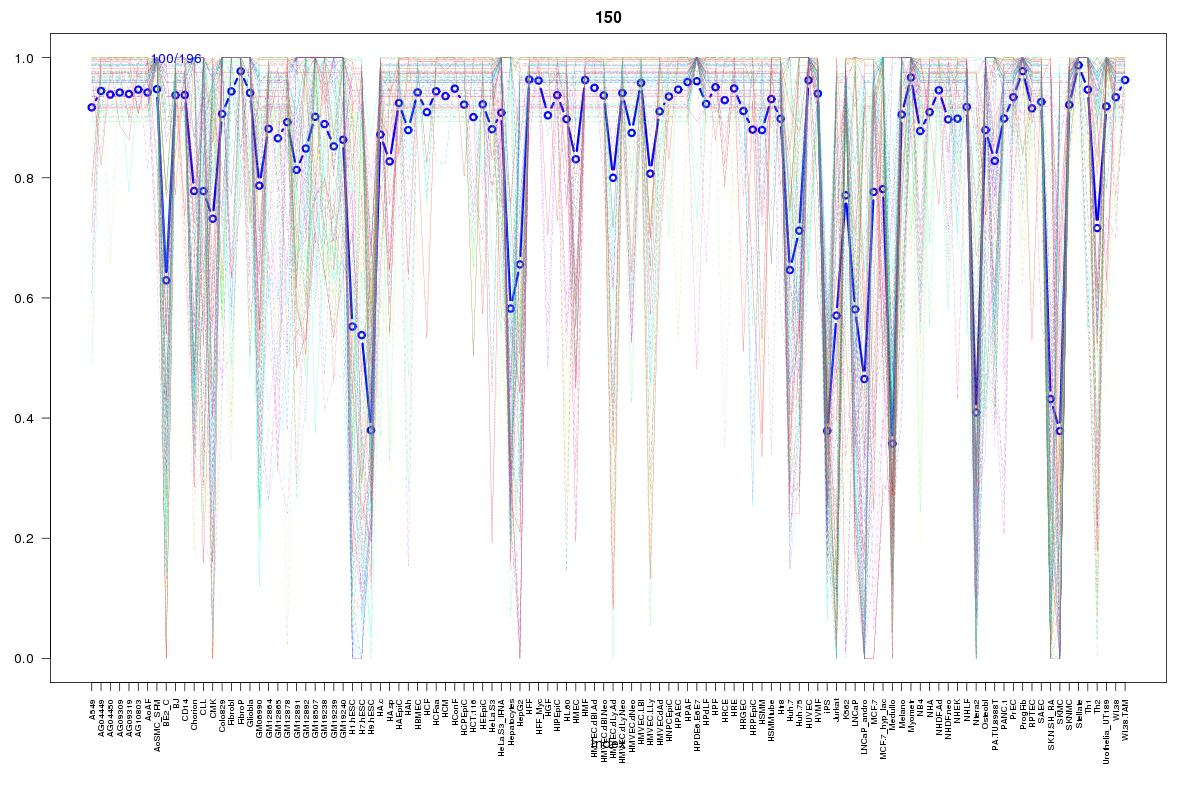 | 150 | 1 |
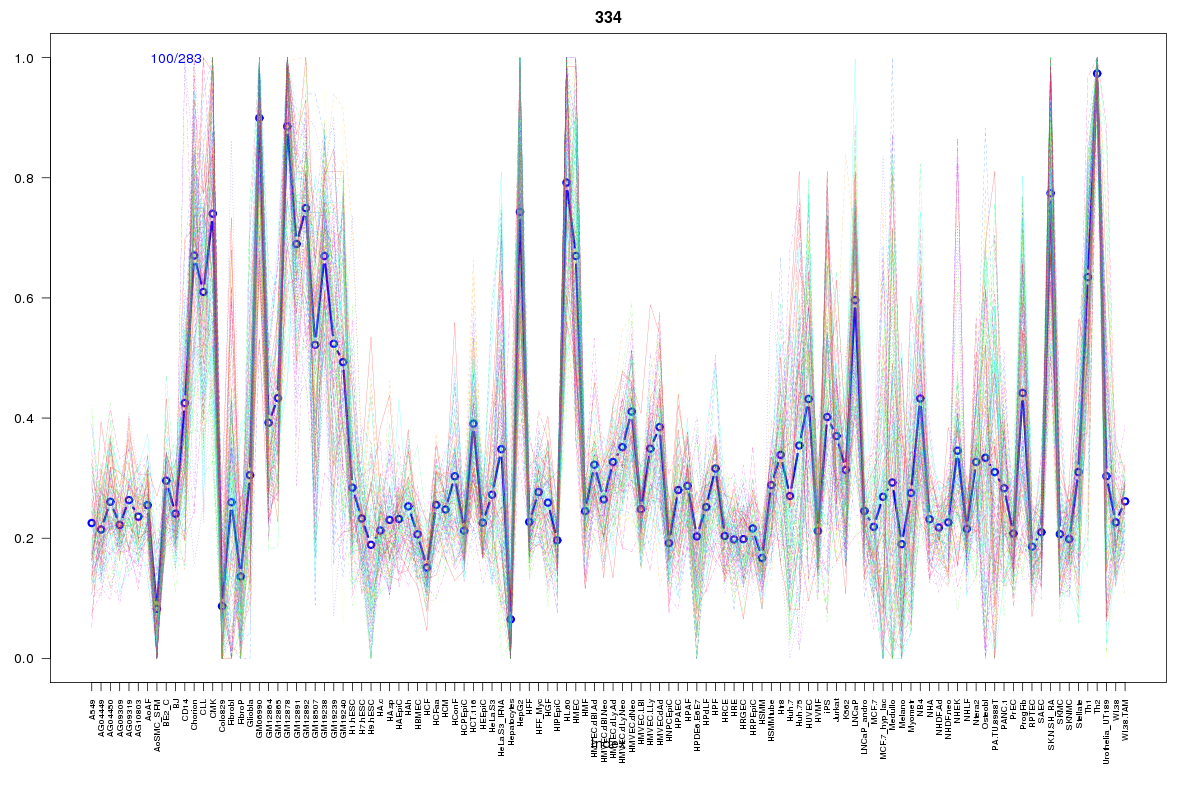 | 334 | 1 |
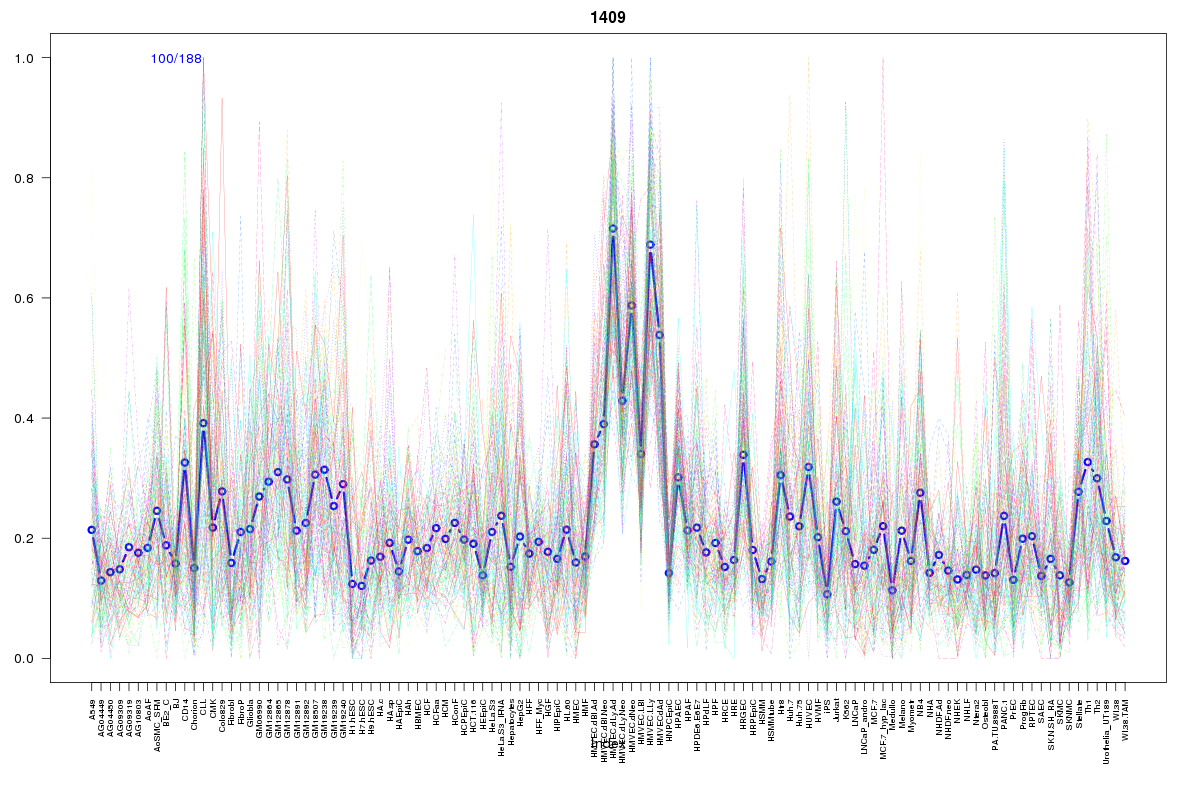 | 1409 | 1 |
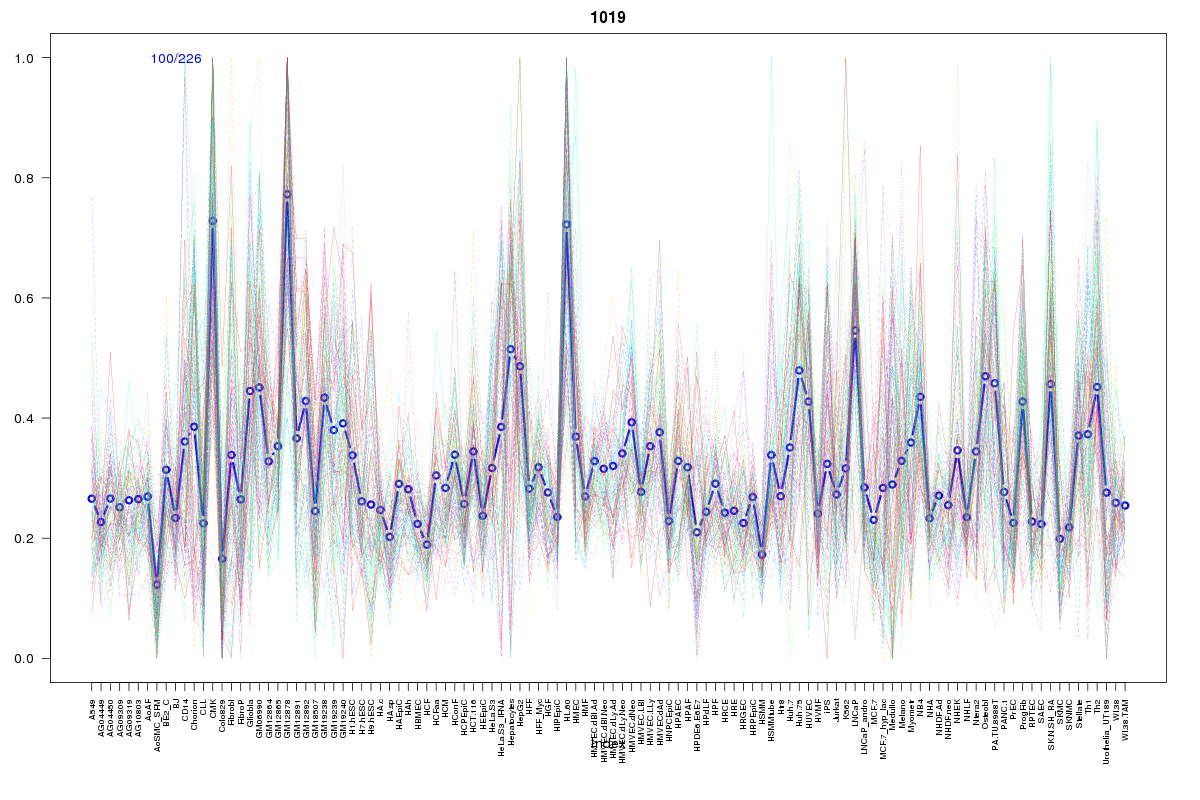 | 1019 | 1 |
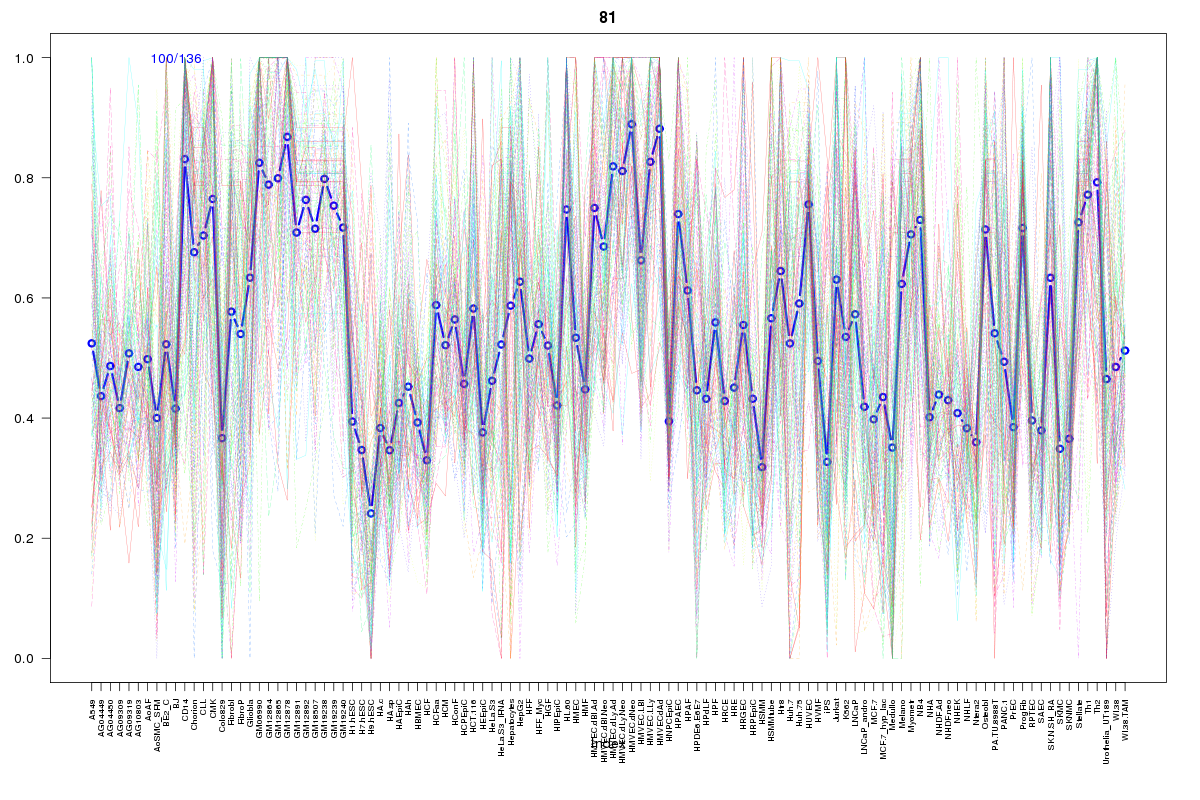 | 81 | 1 |
 | 272 | 1 |
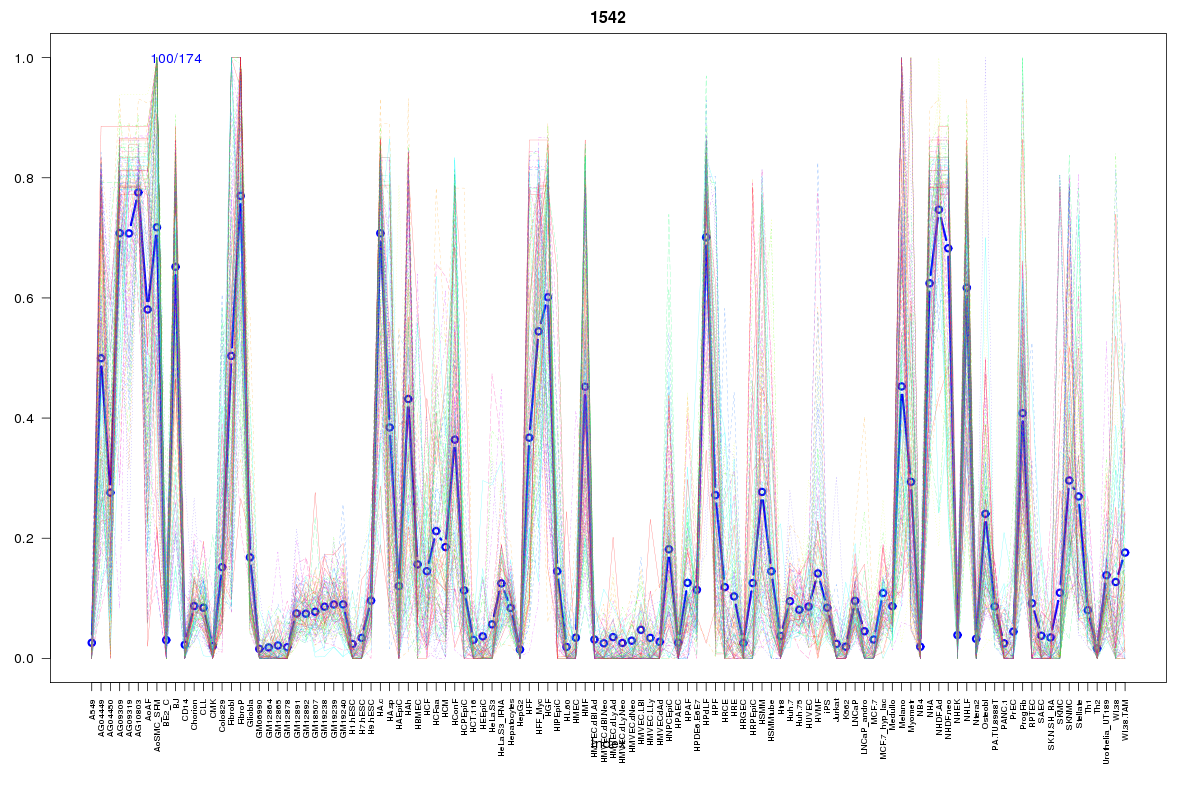 | 1542 | 1 |
 | 15 | 1 |
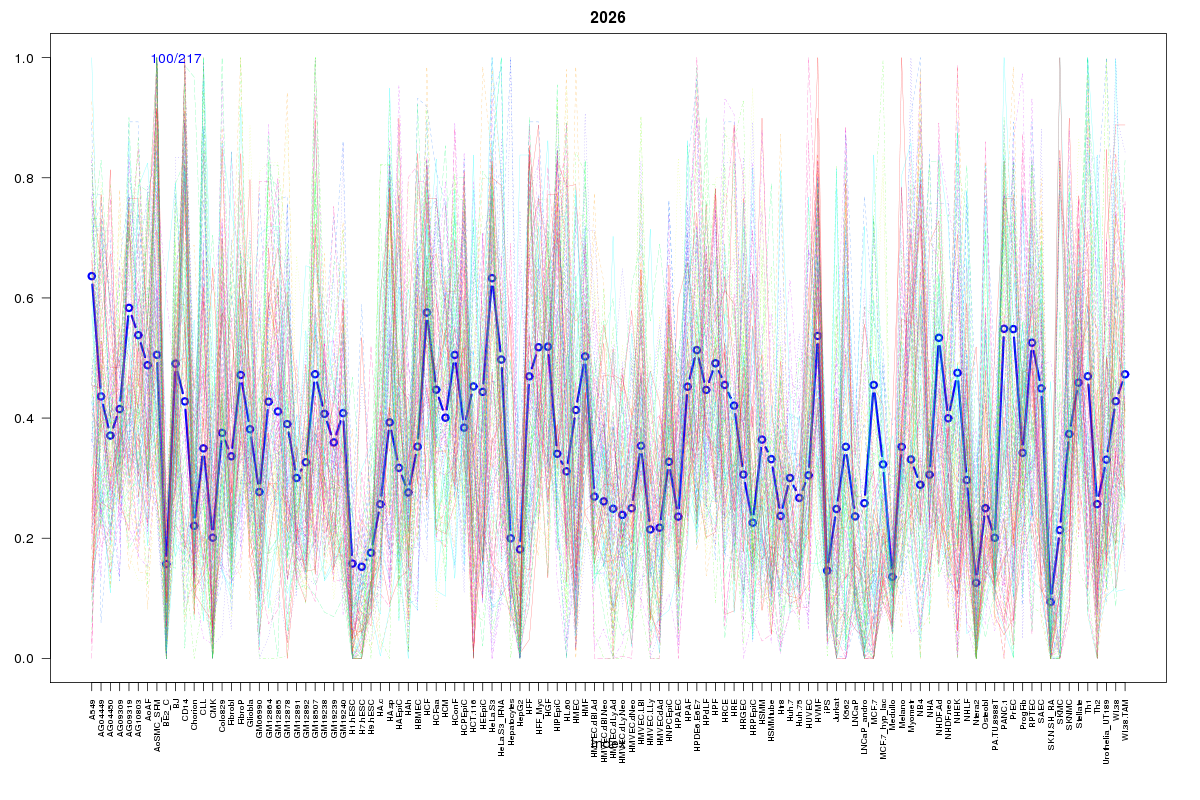 | 2026 | 1 |
Resources
BED file downloads
Connects to 22 DHS sitesTop 10 Correlated DHS Sites
p-values indiciate significant higher or lower correlation| Location | Cluster | P-value |
|---|---|---|
| chr9:2053980-2054130 | 272 | 0 |
| chr9:2017500-2017650 | 81 | 0 |
| chr9:2015305-2015455 | 150 | 0 |
| chr9:2017345-2017495 | 1019 | 0.004 |
| chr9:2127660-2127810 | 1542 | 0.007 |
| chr9:1938820-1938970 | 121 | 0.007 |
| chr9:2012420-2012570 | 2119 | 0.009 |
| chr9:2016840-2016990 | 334 | 0.012 |
| chr9:1939580-1939730 | 66 | 0.012 |
| chr9:2017140-2017290 | 1409 | 0.018 |
| chr9:2014160-2014310 | 1649 | 0.018 |
External Databases
UCSCEnsembl (ENSG00000080503)