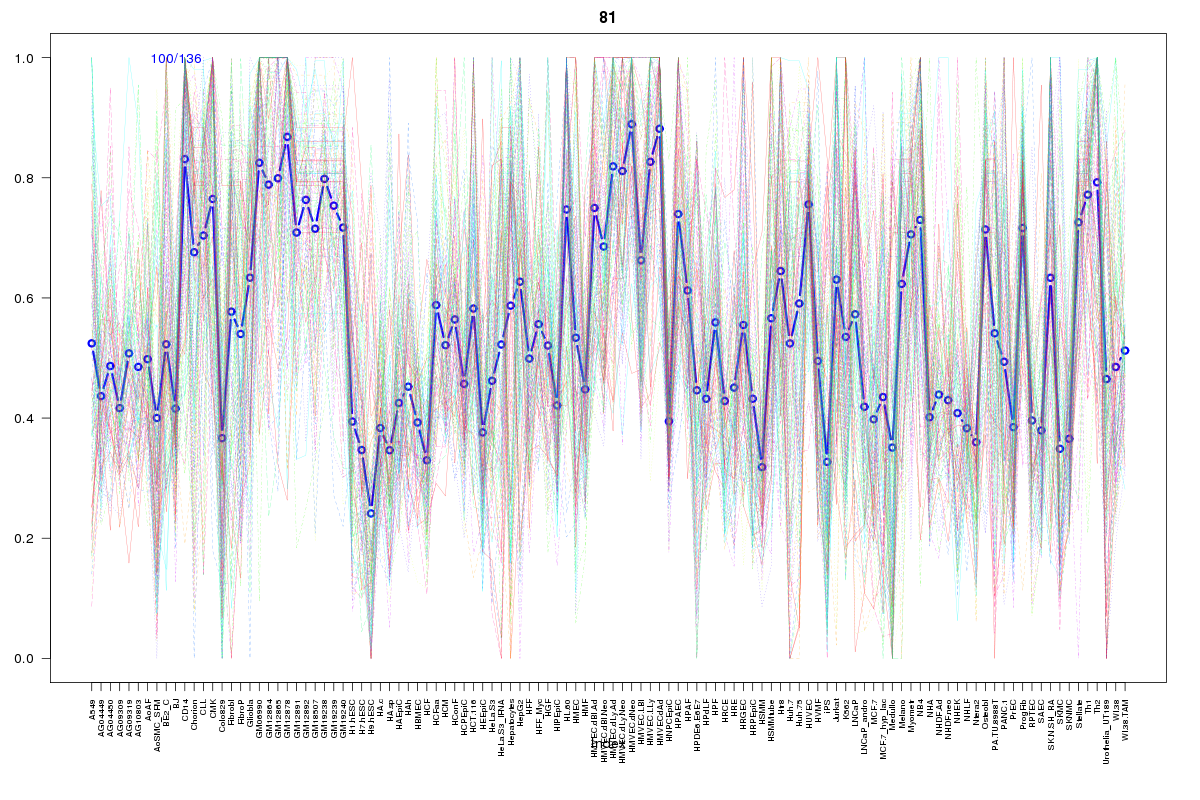
SOM cluster: 81
Cluster Hypersensitivity Profile

Genomic Location Trend
These plots show the distribution of the DHS sites surrounding the Transcript Start Site of the nearest gene.
Stats
Number of sites: 136Promoter: 46%
CpG-Island: 56%
Conserved: 51%
Enriched Motifs & Matches
Match Detail: [Jaspar]
|
| ||
|---|---|---|
| Sites: 88/100 | e-val: 3.1e-25 | ||
| Factor | e-val(match) | DB |
| SP1 | 0.00000003338 | JASPAR |
| TFAP2A | 0.0067663 | JASPAR |
| Klf4 | 0.0086141 | JASPAR |
| Egr1 | 0.013008 | JASPAR |
| INSM1 | 0.06017 | JASPAR |
|
| ||
| Sites: 38/100 | e-val: 0.014 | ||
| Factor | e-val(match) | DB |
| SP1 | 0.00000064159 | JASPAR |
| EWSR1-FLI1 | 0.000011291 | JASPAR |
| Tal1::Gata1 | 0.0021342 | JASPAR |
| Egr1 | 0.0026626 | JASPAR |
| SPI1 | 0.005208 | JASPAR |
BED file downloads
Top 10 Example Regions
| Location | Gene Link | Dist. |
|---|---|---|
| chr8: 123793780-123793930 | ZHX2 | 36.78 |
| chr17: 4047360-4047510 | ZZEF1 | 47.49 |
| chr7: 130791180-130791330 | RNU6-1010P | 55.69 |
| chr6: 12011340-12011490 | HIVEP1 | 57.95 |
| chr15: 101834940-101835090 | SNRPA1 | 58.98 |
| chr17: 4935100-4935250 | AC012146.7 | 66.39 |
| chr17: 4935100-4935250 | ENO3 | 66.39 |
| chr12: 121533800-121533950 | P2RX7 | 70.25 |
| chr12: 121533800-121533950 | SNORA70 | 70.25 |
| chr20: 62670020-62670170 | RGS19 | 70.65 |