SOM cluster: 1909
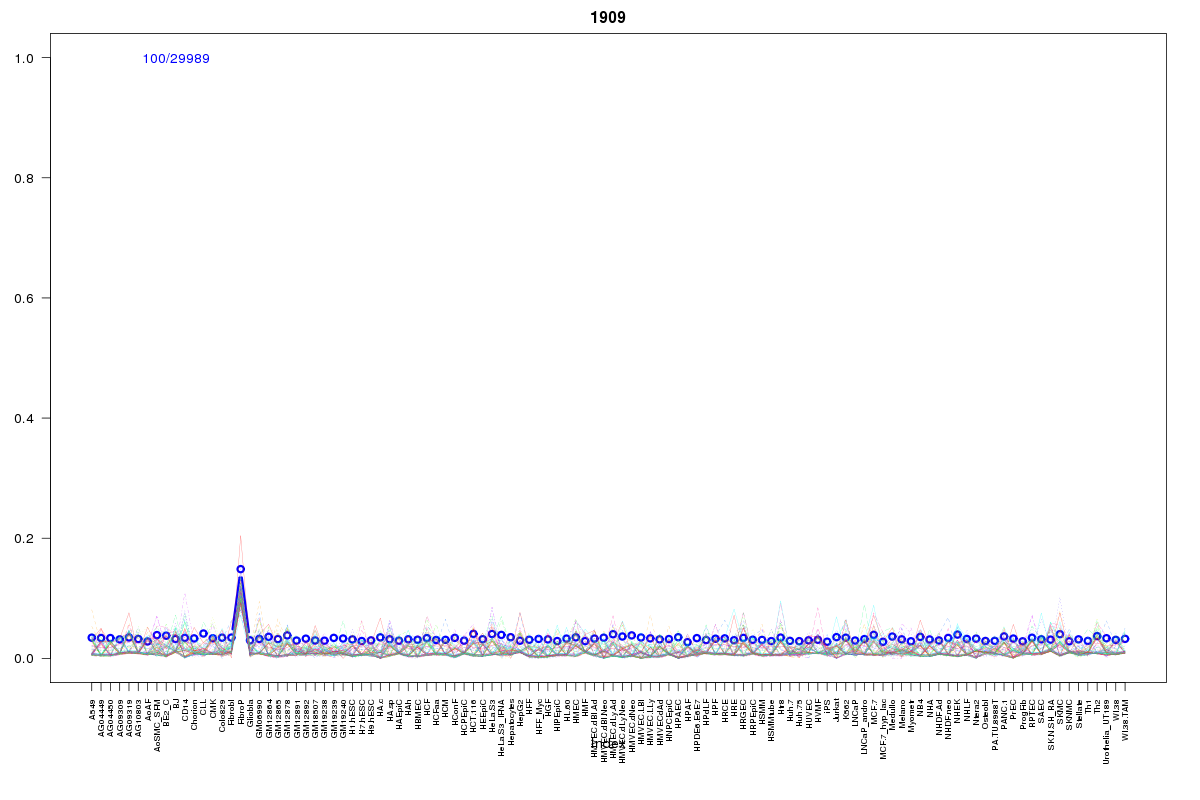
Cluster Hypersensitivity Profile

Genomic Location Trend
These plots show the distribution of the DHS sites surrounding the Transcript Start Site of the nearest gene.
Stats
Number of sites: 29989Promoter: 1%
CpG-Island: 0%
Conserved: 5%
Enriched Motifs & Matches
Match Detail: [Jaspar]
|
| ||
|---|---|---|
| Sites: 28/100 | e-val: 0.0000000000045 | ||
| Factor | e-val(match) | DB |
| Lhx3 | 0.000051552 | JASPAR |
| Foxd3 | 0.00048713 | JASPAR |
| ARID3A | 0.00092079 | JASPAR |
| Pax4 | 0.001269 | JASPAR |
| HNF1B | 0.0014098 | JASPAR |
BED file downloads
Top 10 Example Regions
| Location | Gene Link | Dist. |
|---|---|---|
| chr1: 149953445-149953595 | OTUD7B | 16.23 |
| chr3: 31879085-31879235 | ZNF587P1 | 37.24 |
| chrX: 10027520-10027670 | WWC3-AS1 | 40.46 |
| chr6: 41202725-41202875 | TREML4 | 40.76 |
| chr20: 21255105-21255255 | PLK1S1 | 44.47 |
| chr17: 61966025-61966175 | GH1 | 45.03 |
| chr1: 147263745-147263895 | RP11-533N14.3 | 46.21 |
| chr8: 90498980-90499130 | KRT8P4 | 47.44 |
| chr2: 72266145-72266295 | CYP26B1 | 49.55 |
| chrX: 47437525-47437675 | ARAF | 51.07 |