Gene: GLT8D1
chr3: 52728504-52739807Expression Profile
(log scale)
Graphical Connections
Distribution of linked clusters:
You may find it interesting if many of the connected DHS sites belong to the same cluster.| Cluster Profile | Cluster ID | Number of DHS sites in this cluster |
|---|---|---|
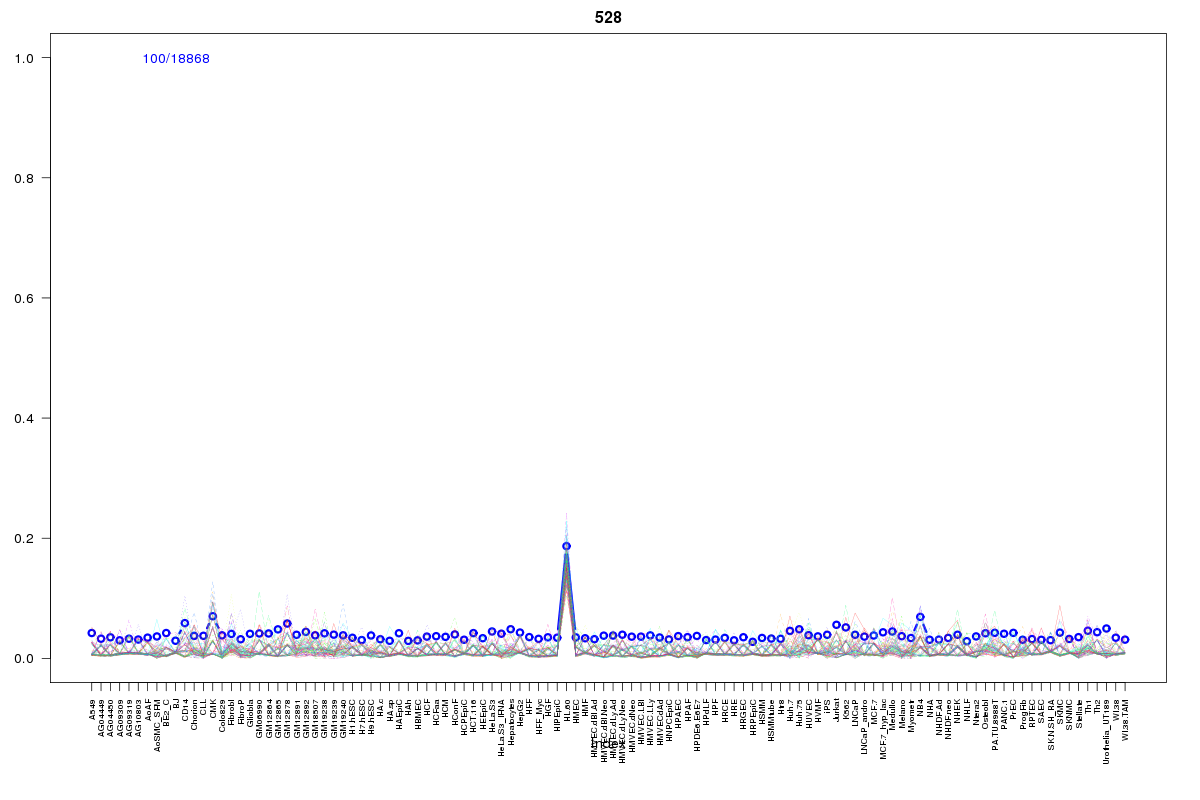 | 528 | 3 |
 | 569 | 3 |
 | 568 | 2 |
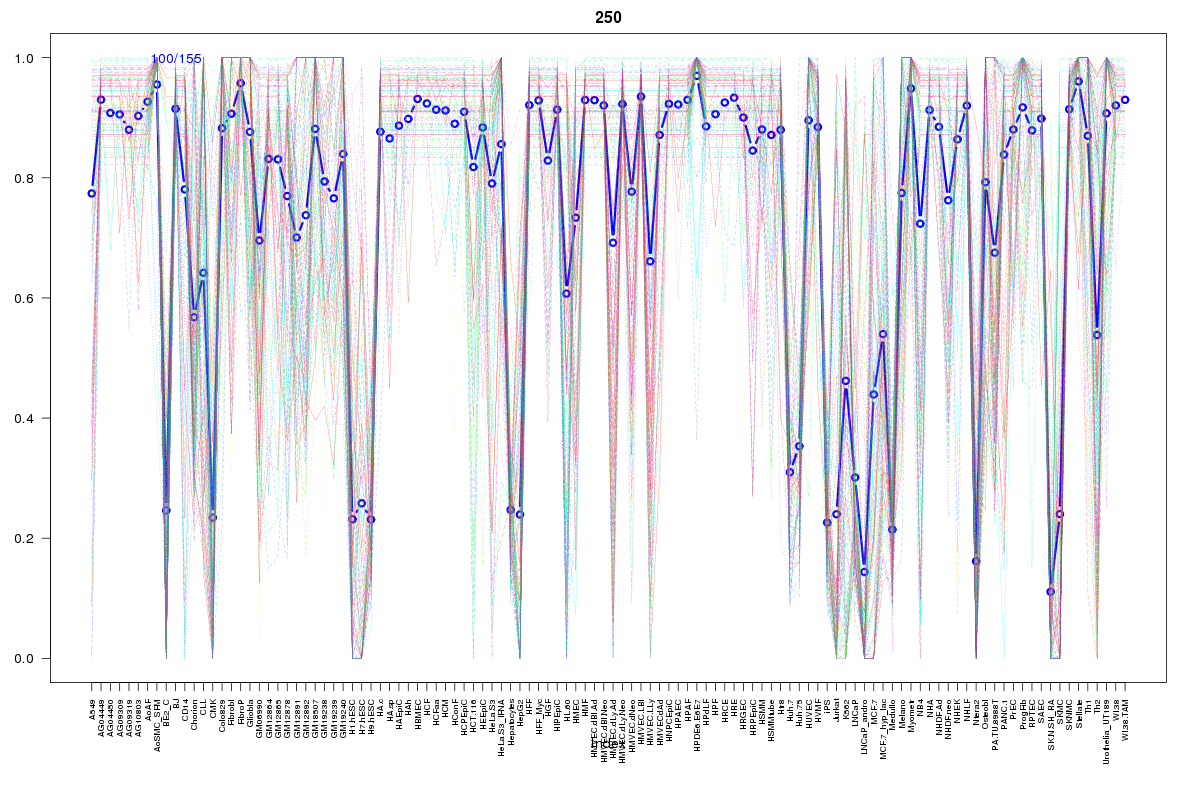 | 250 | 1 |
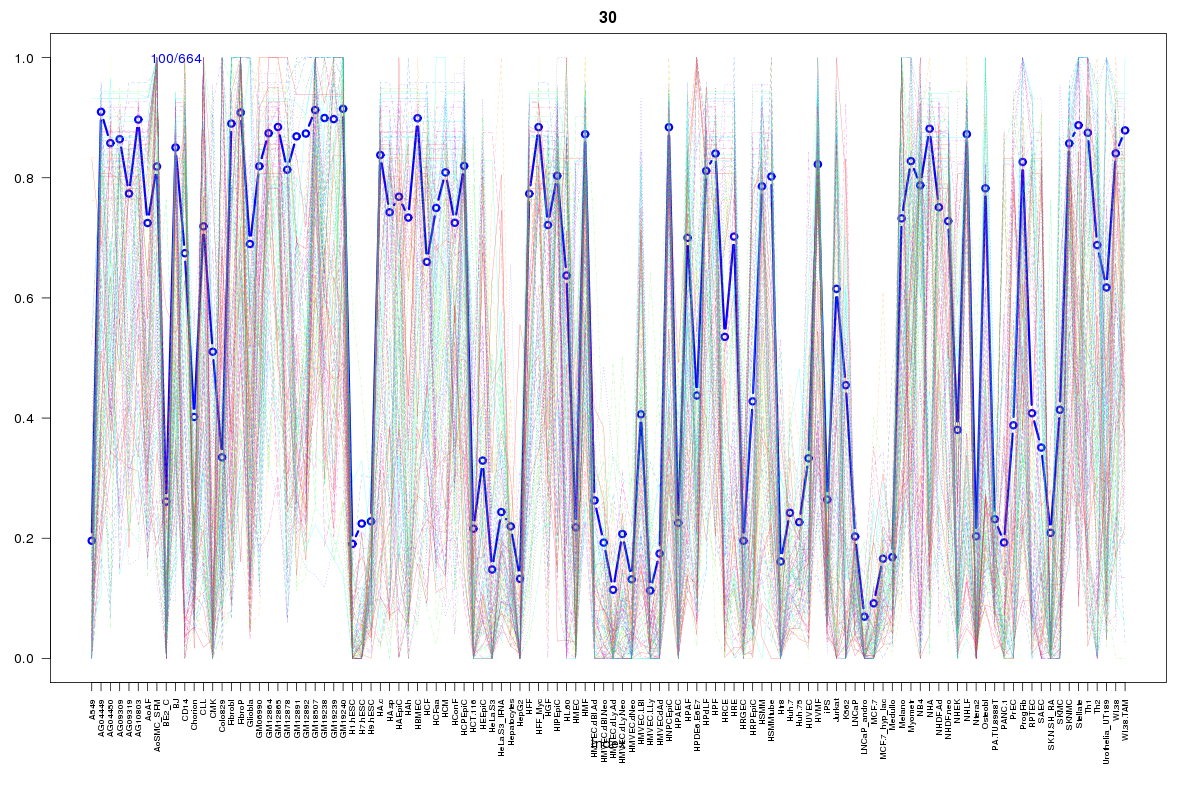 | 30 | 1 |
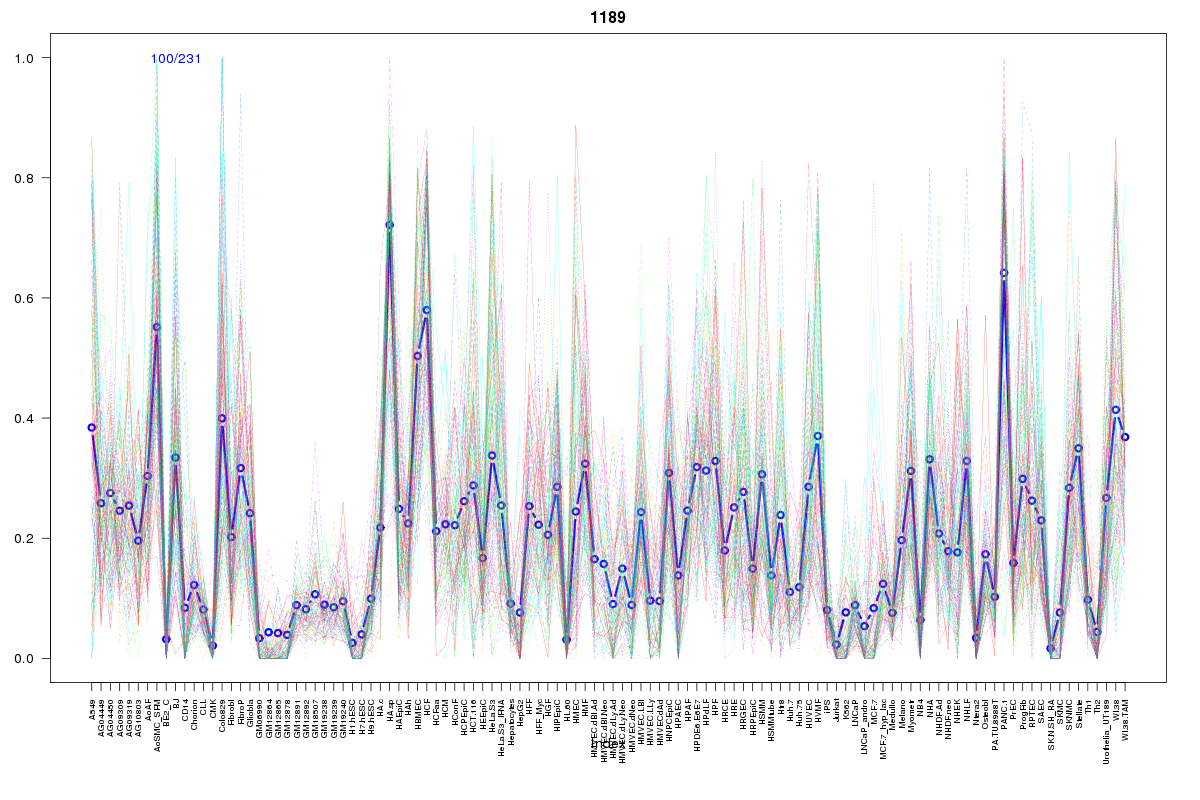 | 1189 | 1 |
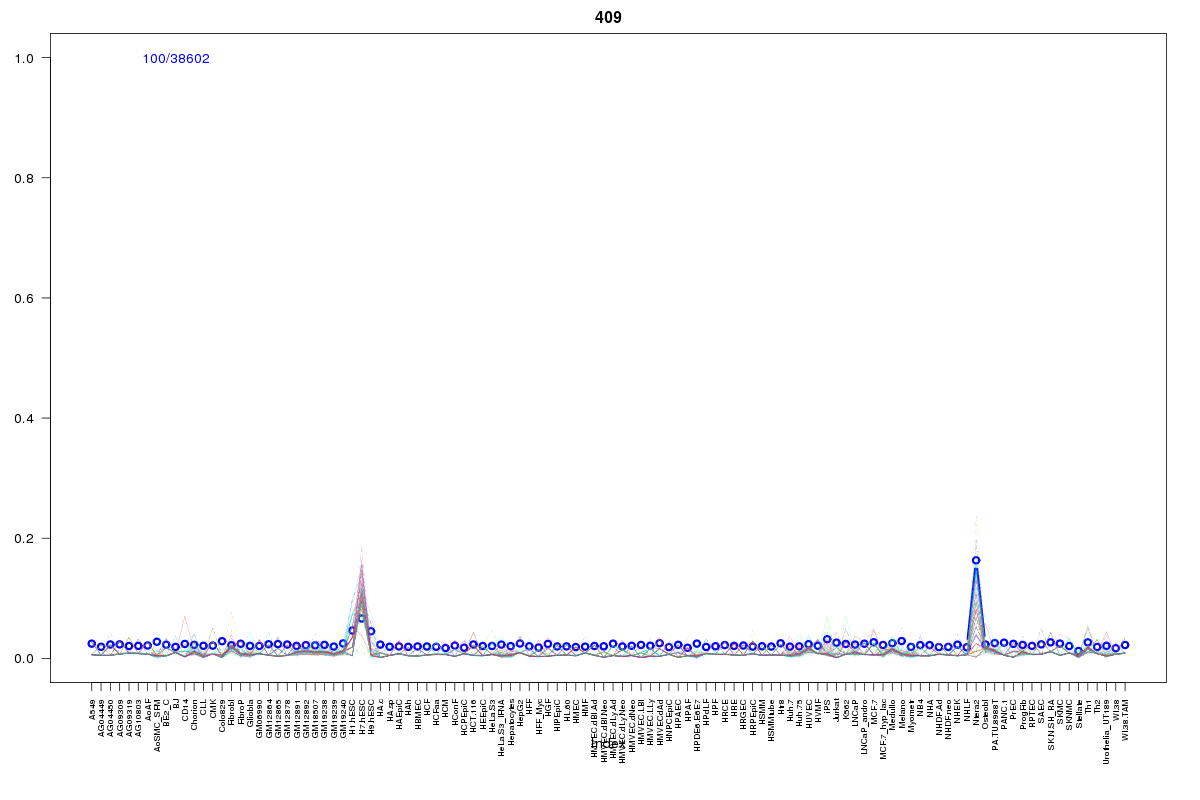 | 409 | 1 |
 | 1070 | 1 |
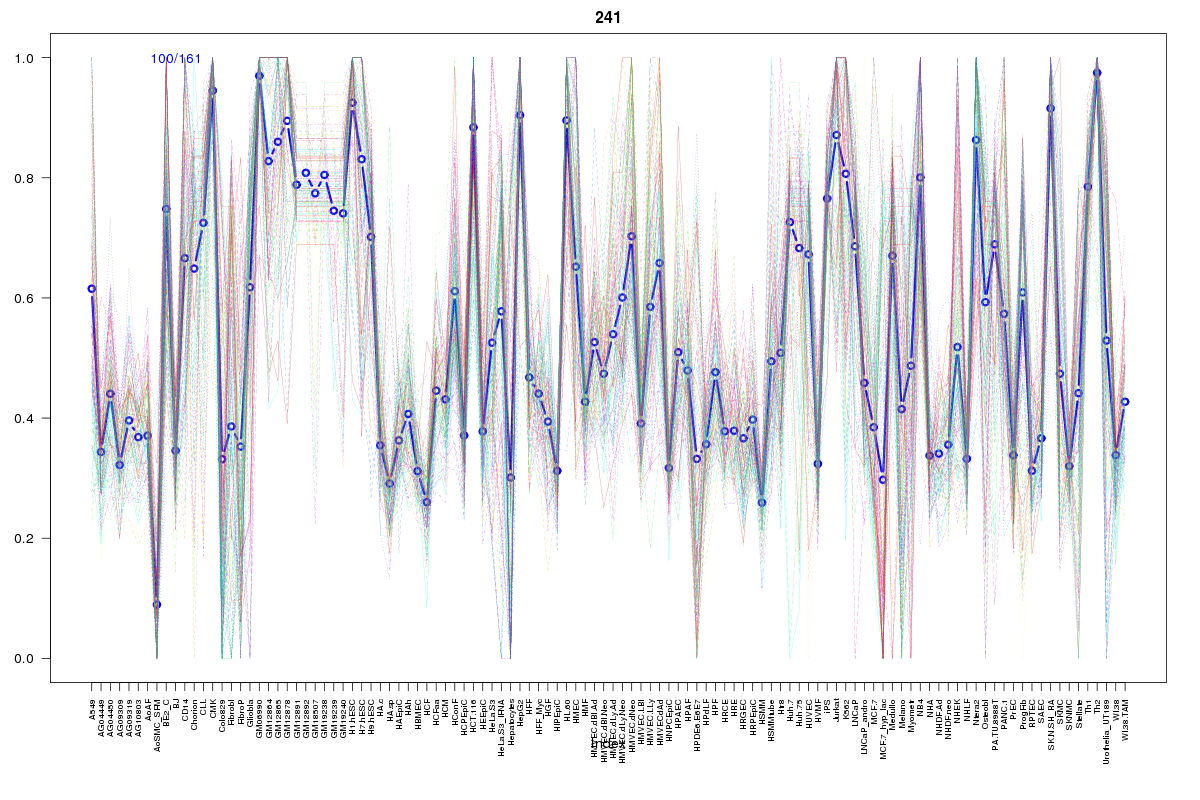 | 241 | 1 |
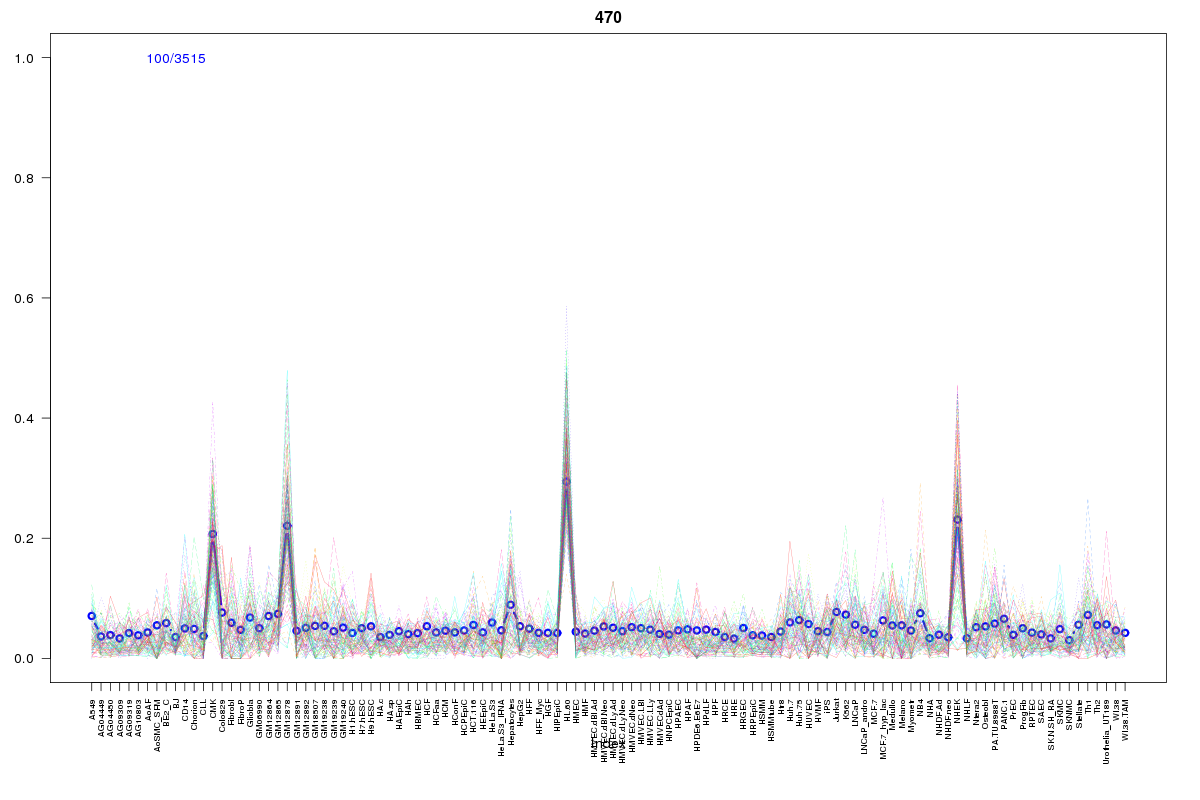 | 470 | 1 |
 | 570 | 1 |
 | 416 | 1 |
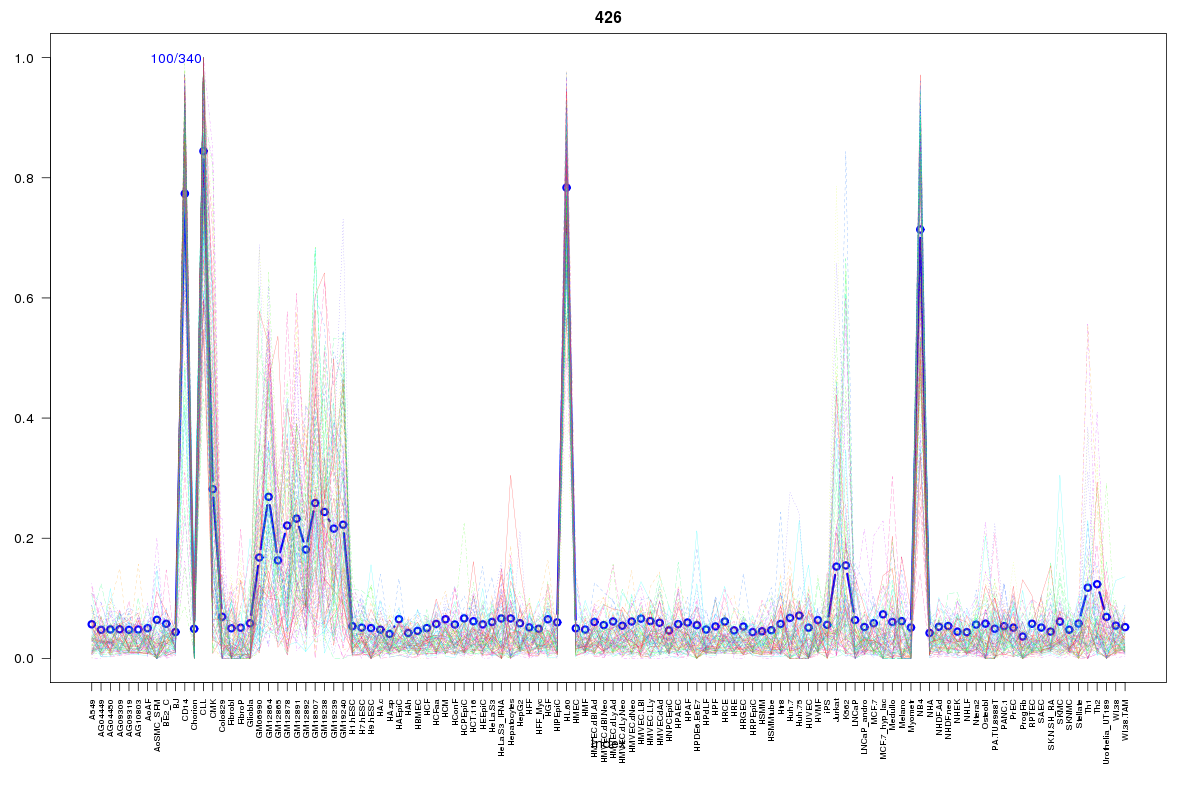 | 426 | 1 |
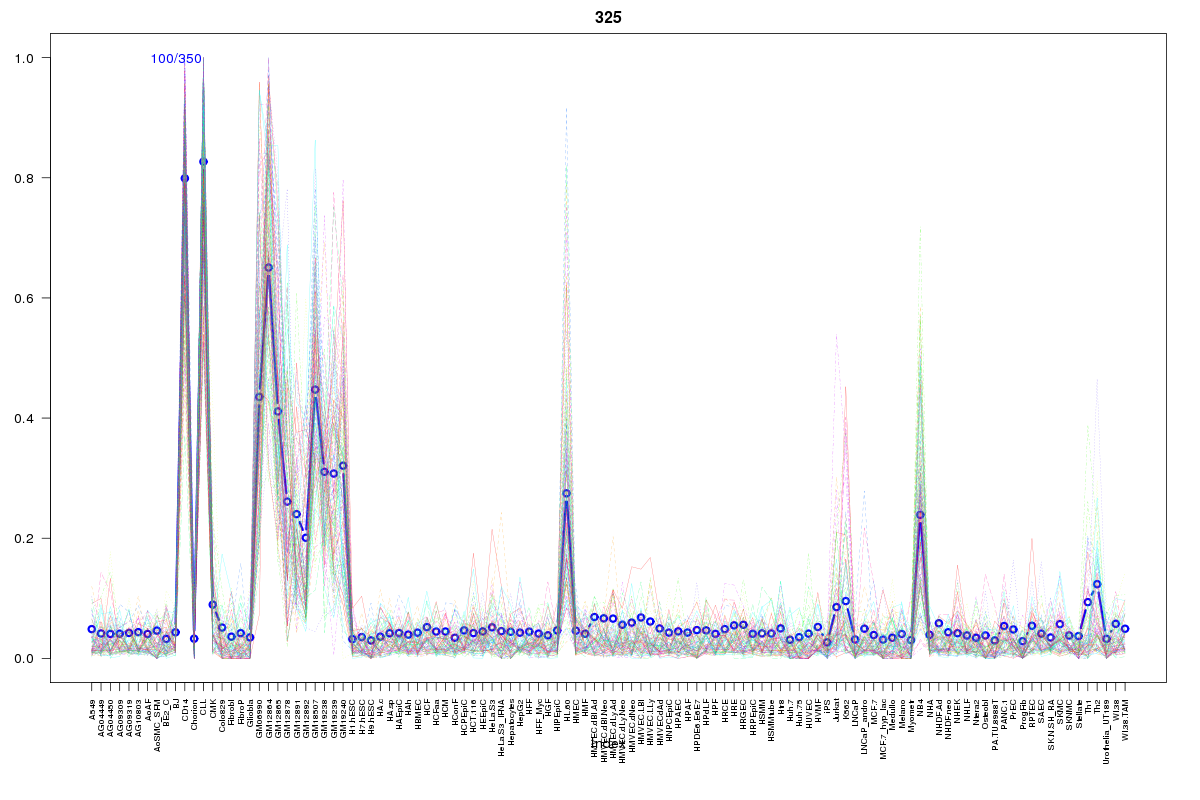 | 325 | 1 |
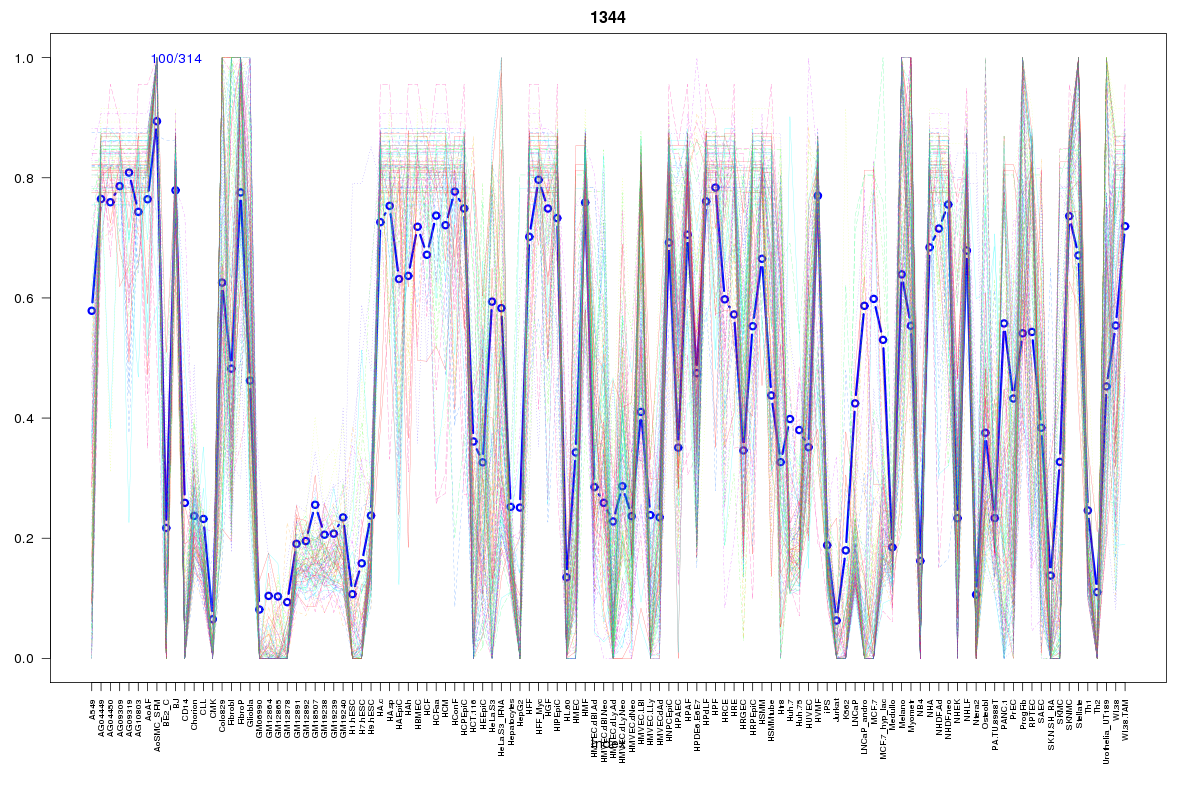 | 1344 | 1 |
Resources
BED file downloads
Connects to 20 DHS sitesTop 10 Correlated DHS Sites
p-values indiciate significant higher or lower correlation| Location | Cluster | P-value |
|---|---|---|
| chr3:52704660-52704810 | 1344 | 0 |
| chr3:52705105-52705255 | 30 | 0.004 |
| chr3:52705260-52705410 | 1189 | 0.009 |
| chr3:52704820-52705090 | 250 | 0.01 |
| chr3:52738240-52738390 | 416 | 0.01 |
| chr3:52716100-52716250 | 1070 | 0.022 |
| chr3:52730200-52730350 | 470 | 0.024 |
| chr3:52635300-52635450 | 568 | 0.023 |
| chr3:52710560-52710710 | 409 | 0.023 |
| chr3:52727620-52727770 | 569 | 0.018 |
| chr3:52729940-52730090 | 528 | 0.017 |
External Databases
UCSCEnsembl (ENSG00000016864)