SOM cluster: 325
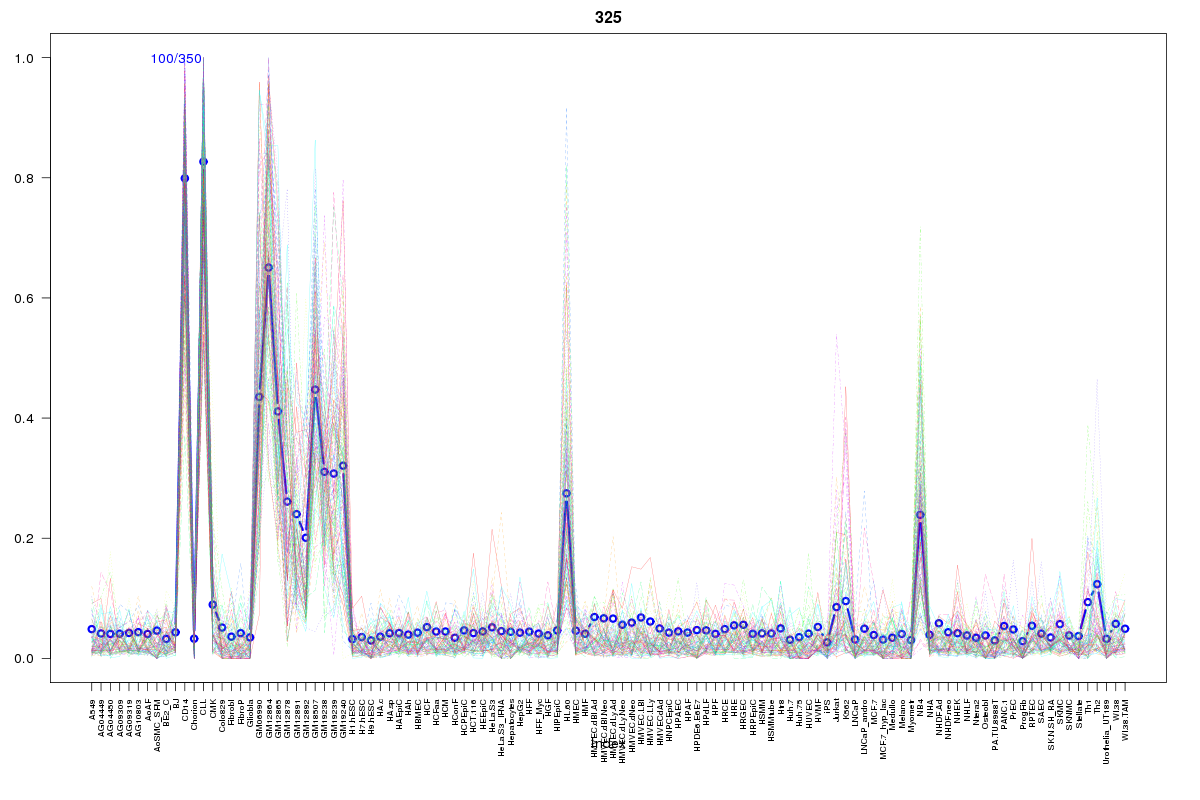
Cluster Hypersensitivity Profile

Genomic Location Trend
These plots show the distribution of the DHS sites surrounding the Transcript Start Site of the nearest gene.
Stats
Number of sites: 350Promoter: 2%
CpG-Island: 0%
Conserved: 37%
Enriched Motifs & Matches
Match Detail: [Jaspar]
|
| ||
|---|---|---|
| Sites: 58/100 | e-val: 0 | ||
| Factor | e-val(match) | DB |
| SPI1 | 0.000000048299 | JASPAR |
| SPIB | 0.00000051061 | JASPAR |
| IRF1 | 0.000011585 | JASPAR |
| FEV | 0.000052008 | JASPAR |
| ELF5 | 0.00028597 | JASPAR |
BED file downloads
Top 10 Example Regions
| Location | Gene Link | Dist. |
|---|---|---|
| chr9: 134316960-134317110 | UCK1 | 47.71 |
| chr9: 134316960-134317110 | POMT1 | 47.71 |
| chr8: 18704600-18704750 | PSD3 | 49.33 |
| chr8: 18704600-18704750 | RPL35P6 | 49.33 |
| chr8: 96066540-96066690 | PLEKHF2 | 49.73 |
| chr17: 62140600-62140750 | TEX2 | 52.88 |
| chr9: 115981560-115981710 | SLC31A1 | 55.62 |
| chr1: 161688720-161688870 | RPL31P11 | 60.3 |
| chr1: 161688720-161688870 | RP11-25K21.1 | 60.3 |
| chr1: 161688720-161688870 | FCGR2B | 60.3 |