SOM cluster: 426
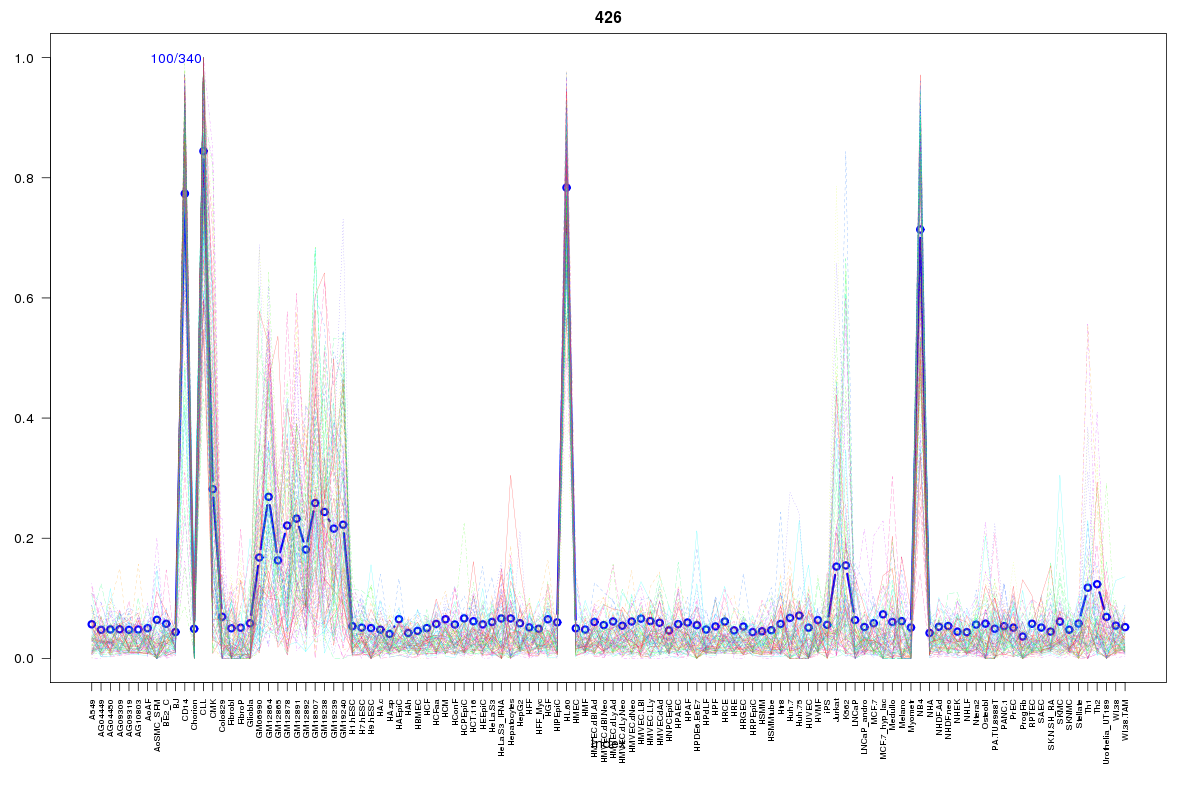
Cluster Hypersensitivity Profile

Genomic Location Trend
These plots show the distribution of the DHS sites surrounding the Transcript Start Site of the nearest gene.
Stats
Number of sites: 340Promoter: 6%
CpG-Island: 0%
Conserved: 26%
Enriched Motifs & Matches
Match Detail: [Jaspar]
|
| ||
|---|---|---|
| Sites: 73/100 | e-val: 0 | ||
| Factor | e-val(match) | DB |
| SPI1 | 0.000000023692 | JASPAR |
| SPIB | 0.00000058182 | JASPAR |
| FEV | 0.000076572 | JASPAR |
| ELF5 | 0.00040937 | JASPAR |
| ELK4 | 0.0011617 | JASPAR |
BED file downloads
Top 10 Example Regions
| Location | Gene Link | Dist. |
|---|---|---|
| chr7: 141660560-141660710 | CLEC5A | 27.54 |
| chr7: 141660560-141660710 | MGAM | 27.54 |
| chr1: 147790320-147790470 | RNU1-120P | 28.81 |
| chr22: 37229200-37229350 | NCF4 | 45.78 |
| chr20: 2665600-2665750 | SNORD56 | 50.4 |
| chr3: 138609680-138609830 | PIK3CB | 51.03 |
| chr5: 57787140-57787290 | GAPT | 51.09 |
| chr5: 57787140-57787290 | PLK2 | 51.09 |
| chr11: 60048020-60048170 | MS4A4E | 52.98 |
| chr10: 70804340-70804490 | KIAA1279 | 54.88 |