Gene: Y_RNA
chr20: 5094638-5094729Expression Profile
(log scale)
Graphical Connections
Distribution of linked clusters:
You may find it interesting if many of the connected DHS sites belong to the same cluster.| Cluster Profile | Cluster ID | Number of DHS sites in this cluster |
|---|---|---|
 | 862 | 1 |
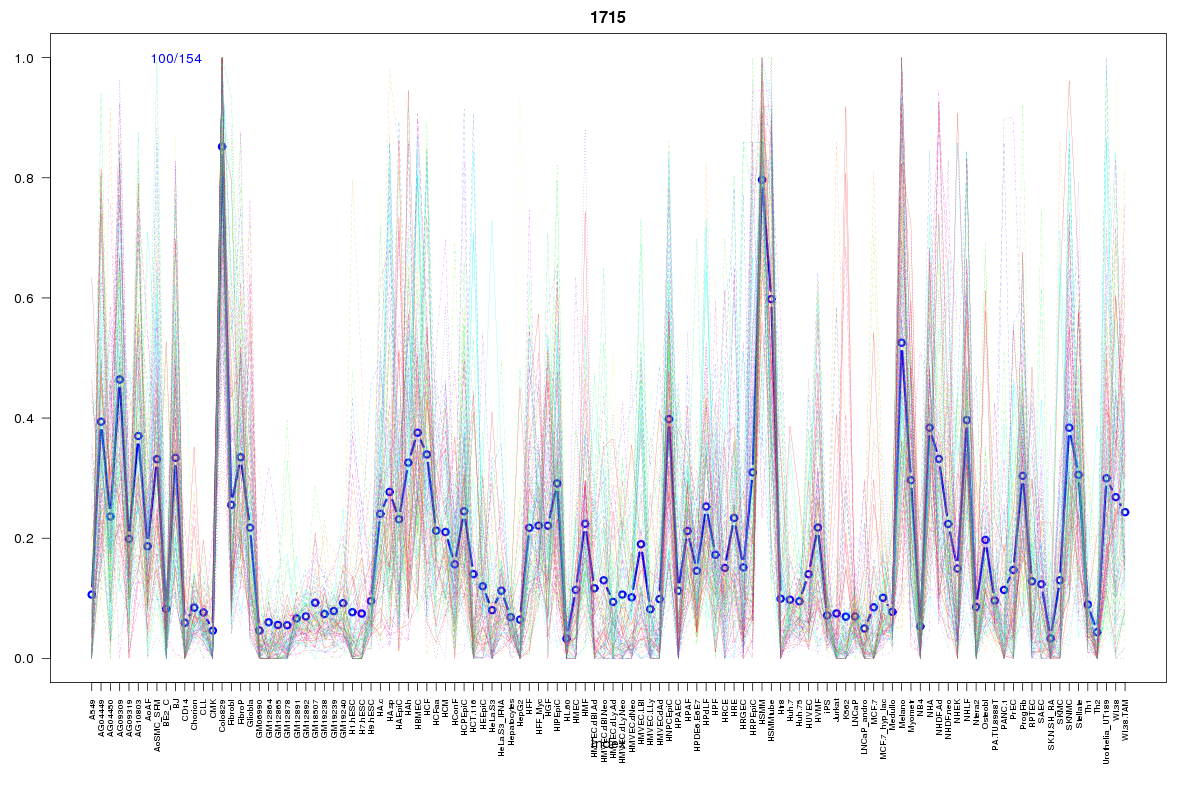 | 1715 | 1 |
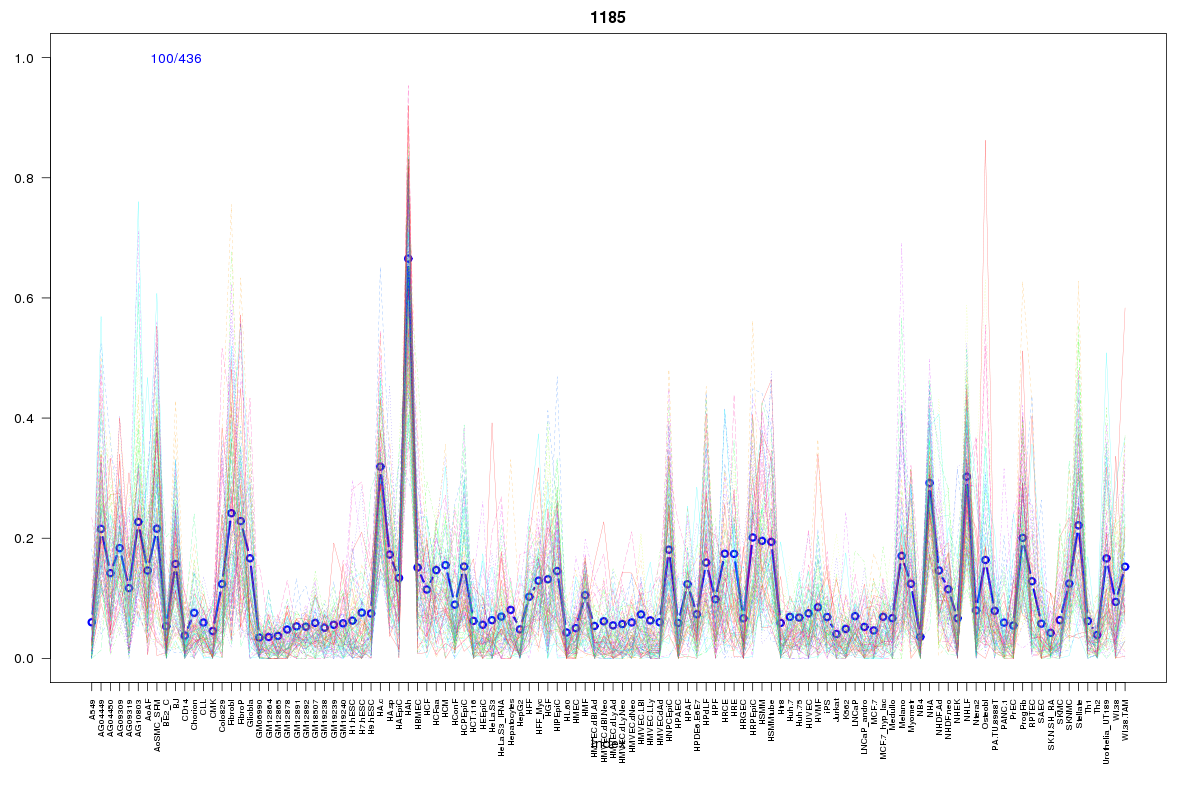 | 1185 | 1 |
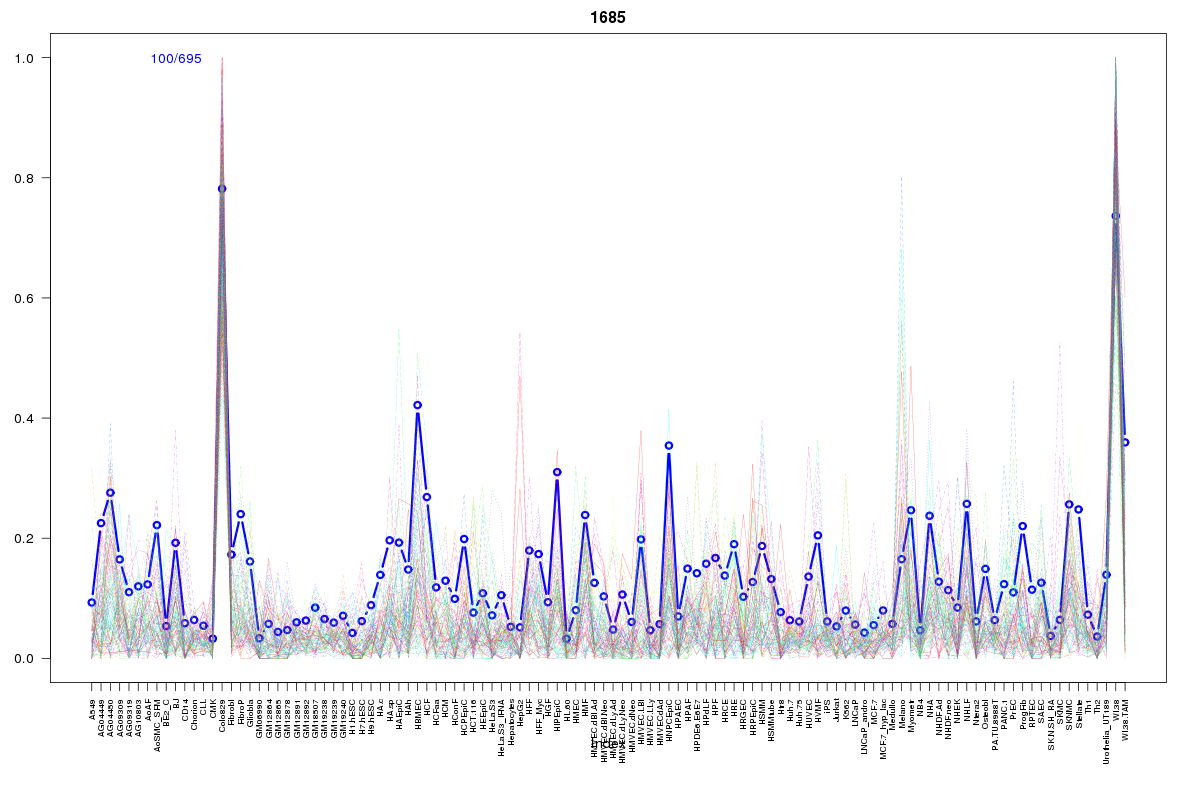 | 1685 | 1 |
 | 860 | 1 |
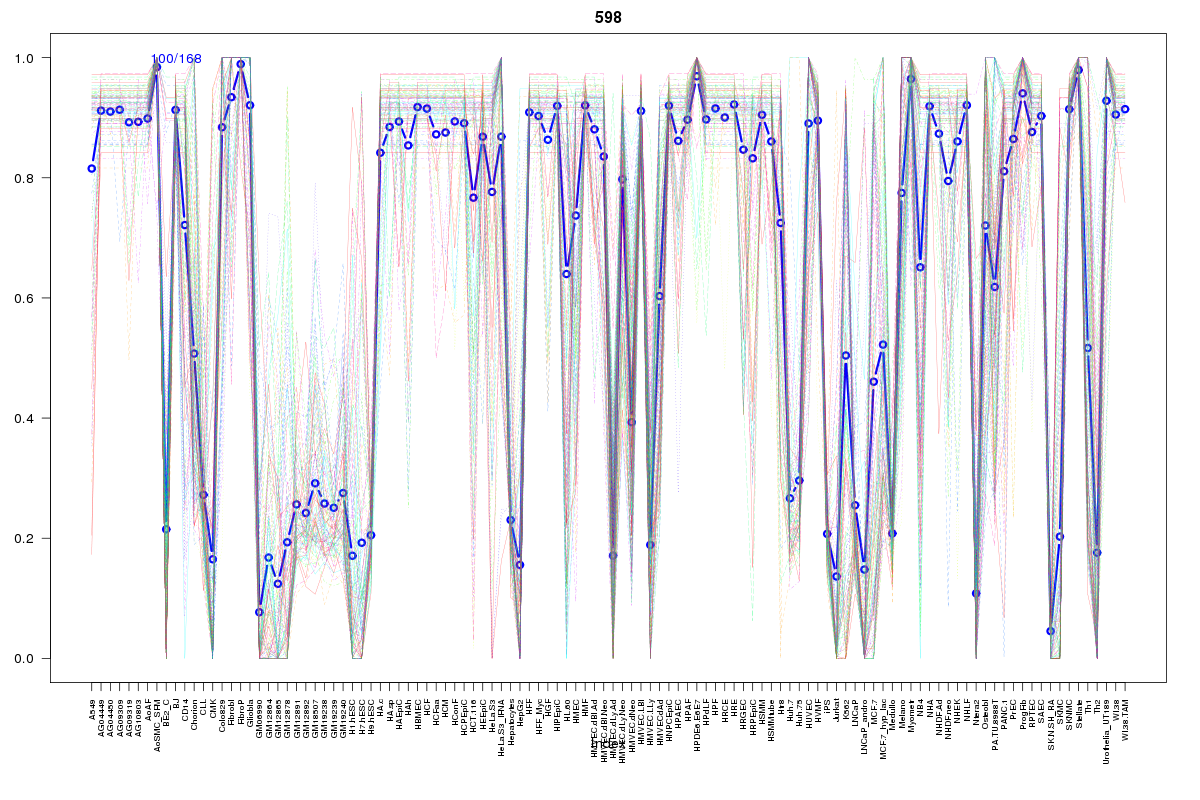 | 598 | 1 |
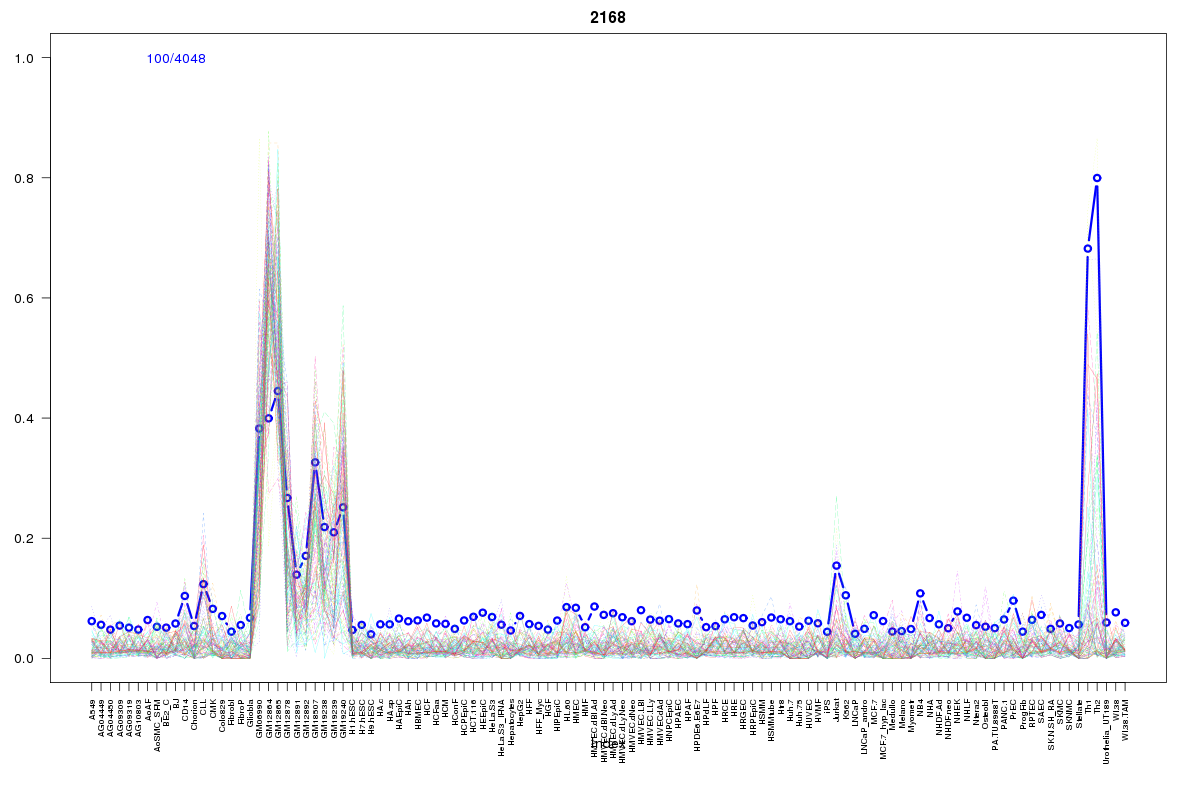 | 2168 | 1 |
 | 2062 | 1 |
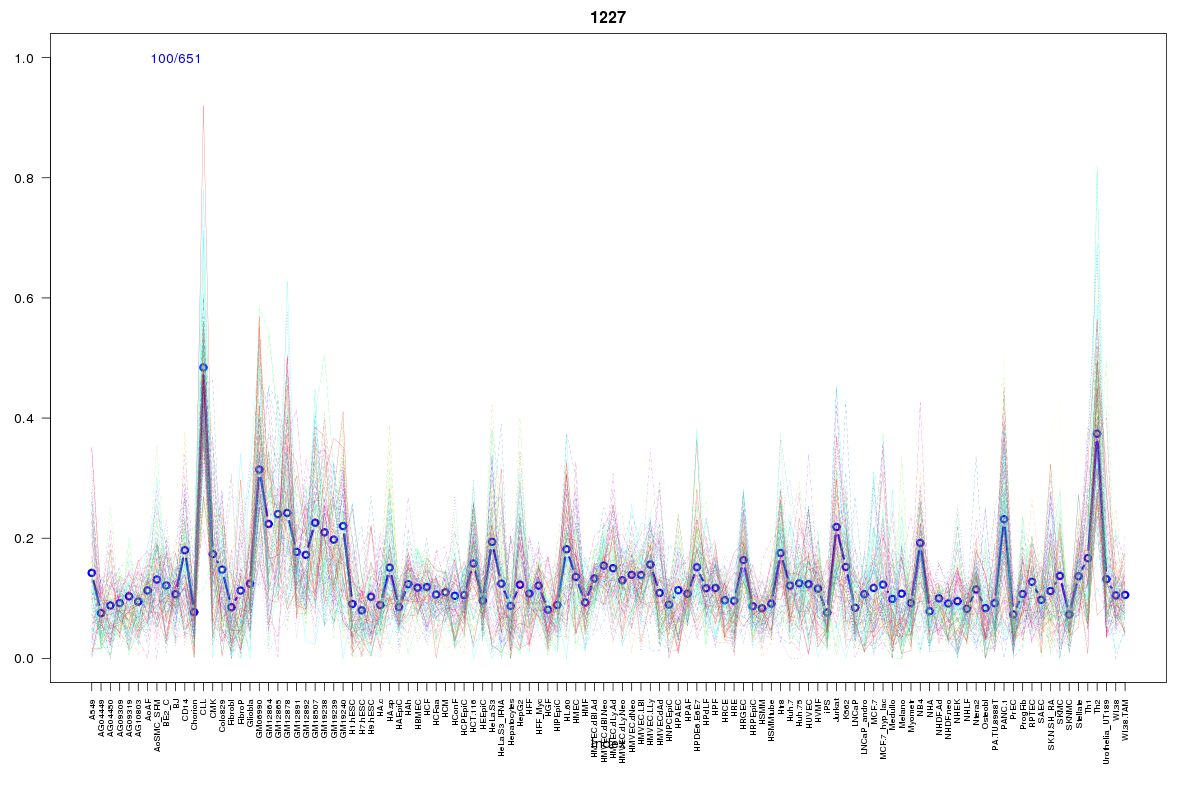 | 1227 | 1 |
 | 130 | 1 |
 | 2072 | 1 |
 | 430 | 1 |
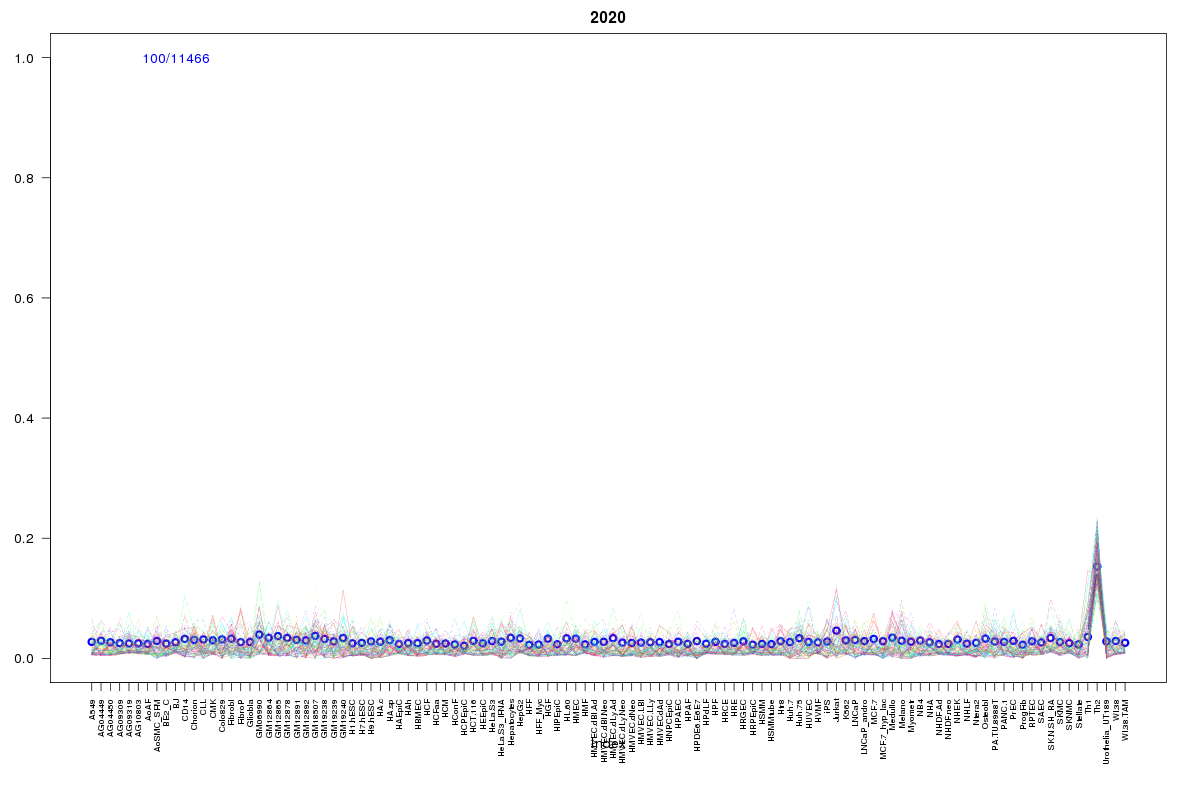 | 2020 | 1 |
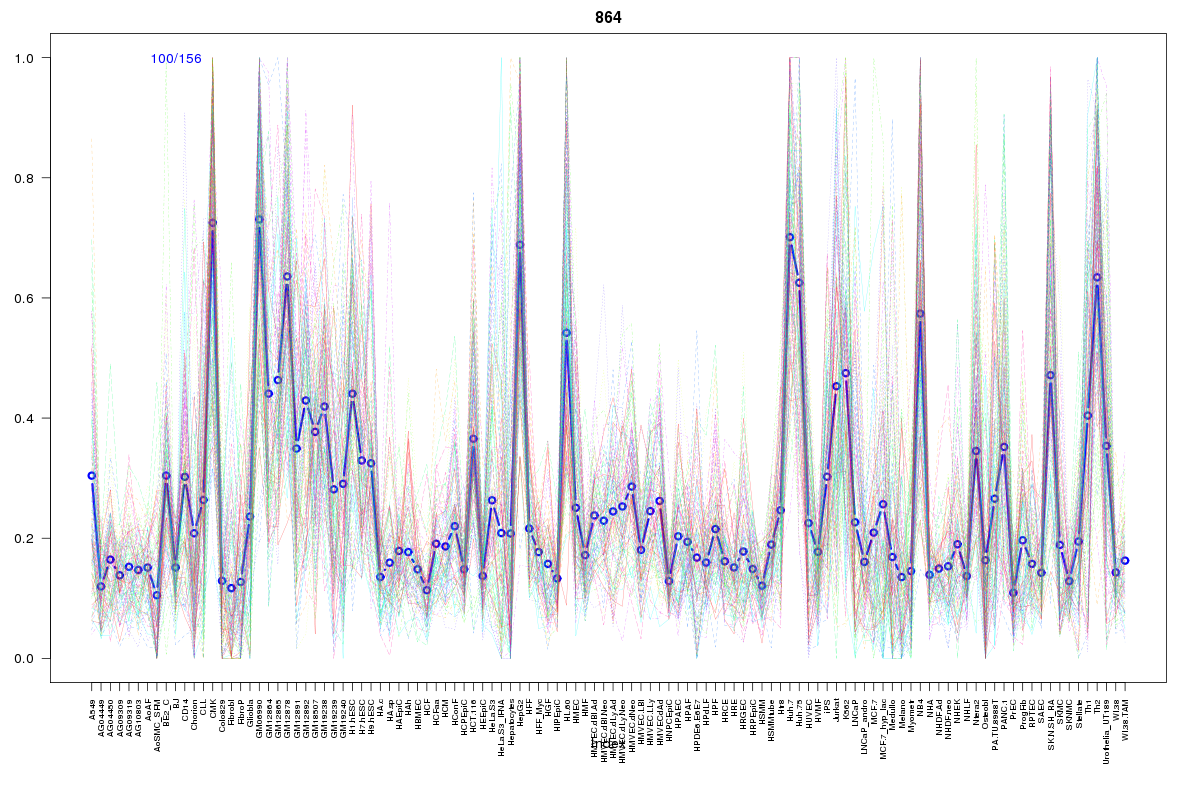 | 864 | 1 |
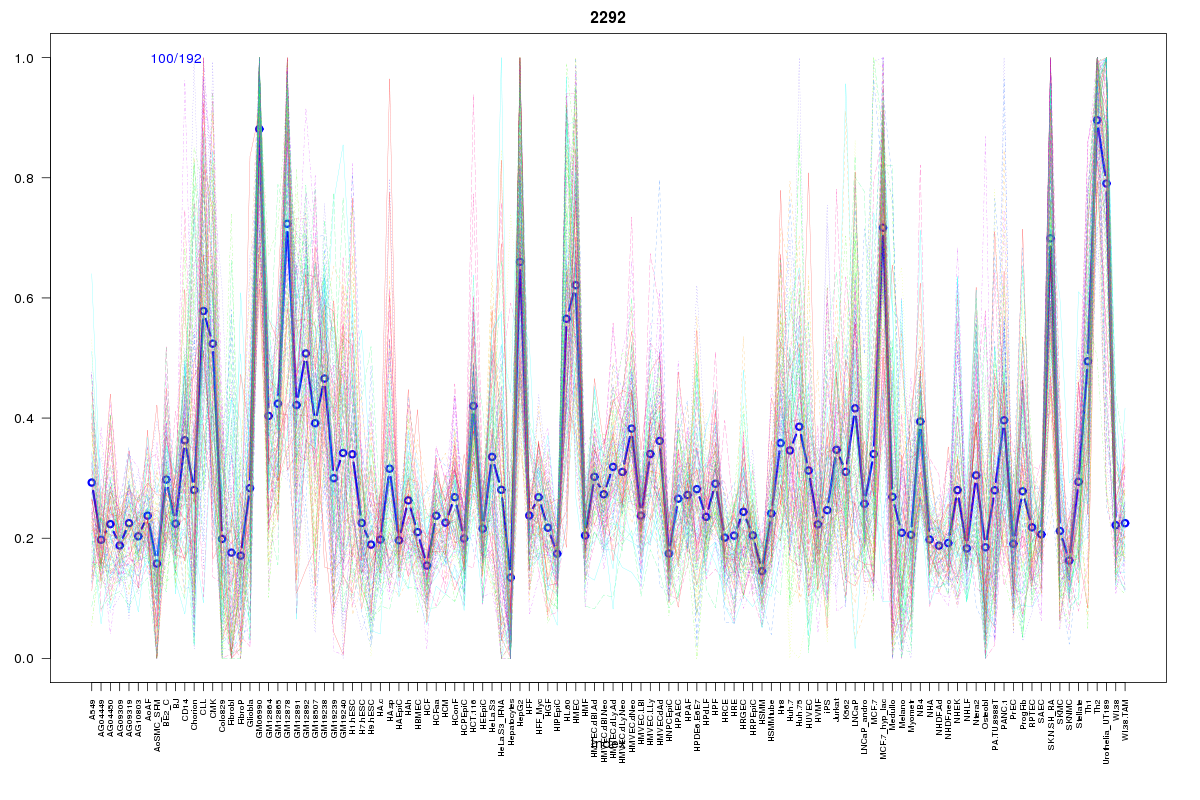 | 2292 | 1 |
 | 469 | 1 |
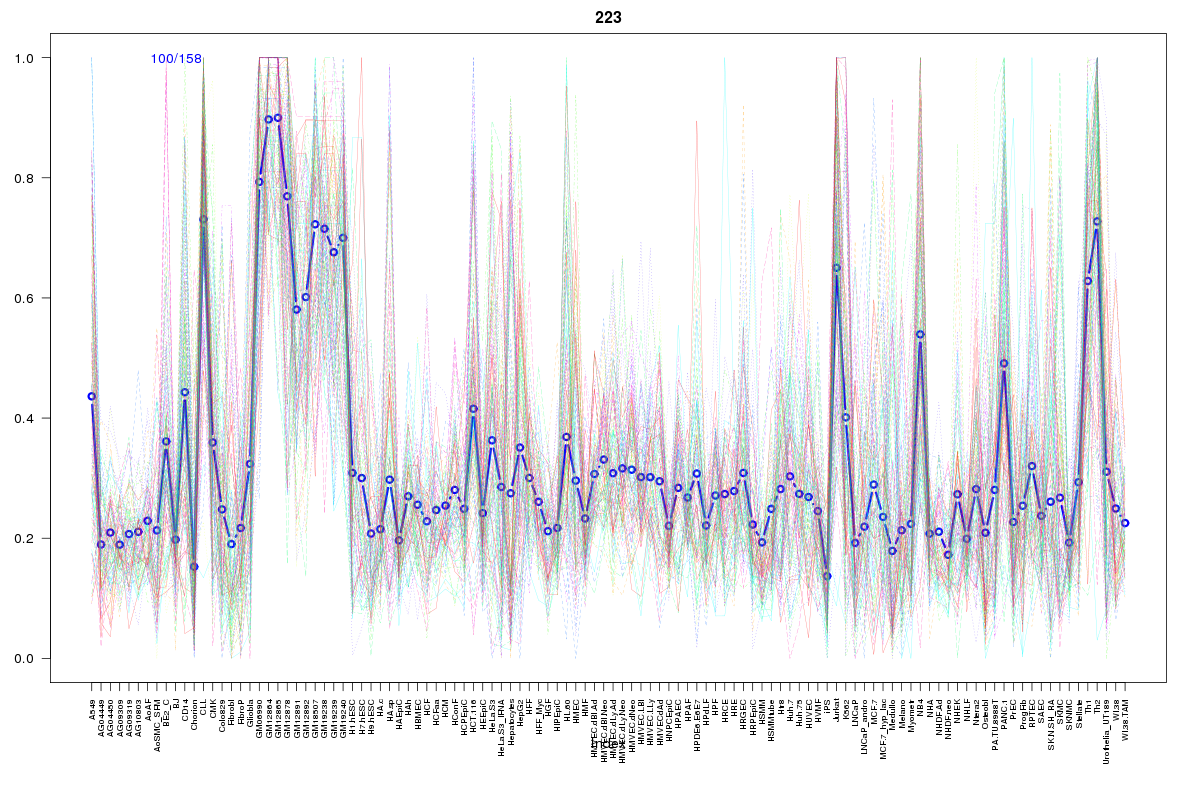 | 223 | 1 |
Resources
BED file downloads
Connects to 17 DHS sitesTop 10 Correlated DHS Sites
p-values indiciate significant higher or lower correlation| Location | Cluster | P-value |
|---|---|---|
| chr20:5094000-5094150 | 864 | 0 |
| chr20:5059580-5059730 | 2072 | 0.003 |
| chr20:5108060-5108210 | 469 | 0.004 |
| chr20:5058680-5058830 | 2168 | 0.006 |
| chr20:5100320-5100470 | 2292 | 0.011 |
| chr20:5108280-5108430 | 223 | 0.011 |
| chr20:5059240-5059390 | 130 | 0.011 |
| chr20:5060080-5060230 | 430 | 0.012 |
| chr20:5059000-5059150 | 1227 | 0.016 |
| chr20:5077865-5078015 | 2020 | 0.017 |
| chr20:5040640-5040790 | 860 | 0.017 |
External Databases
UCSCEnsembl (ENSG00000252367)