Gene: ACY1
chr3: 52009065-52023199Expression Profile
(log scale)
Graphical Connections
Distribution of linked clusters:
You may find it interesting if many of the connected DHS sites belong to the same cluster.| Cluster Profile | Cluster ID | Number of DHS sites in this cluster |
|---|---|---|
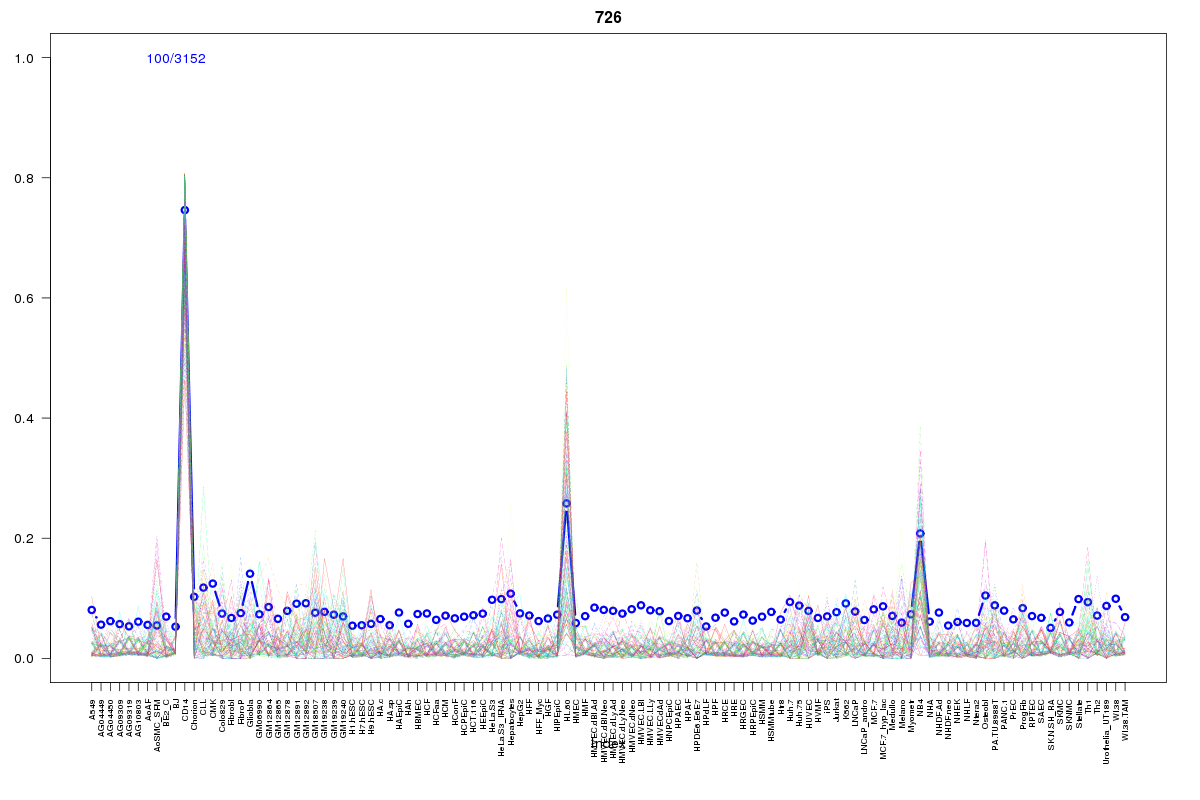 | 726 | 2 |
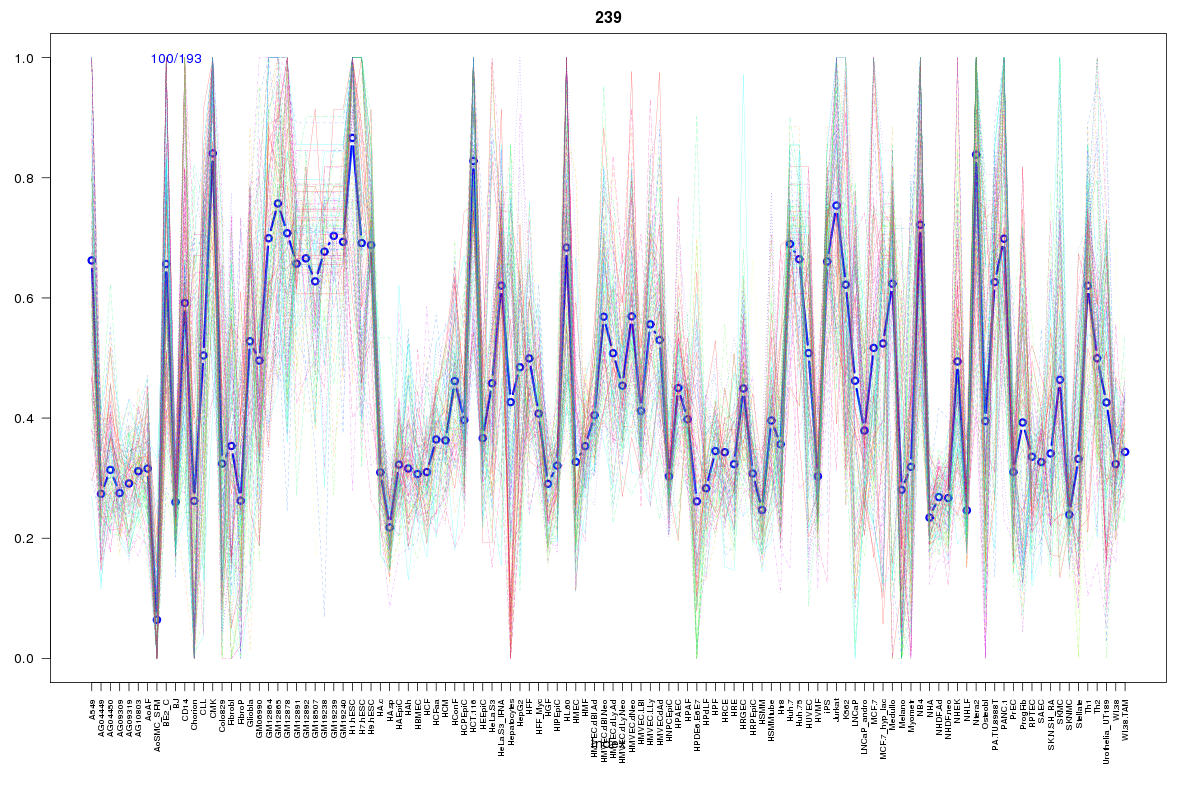 | 239 | 1 |
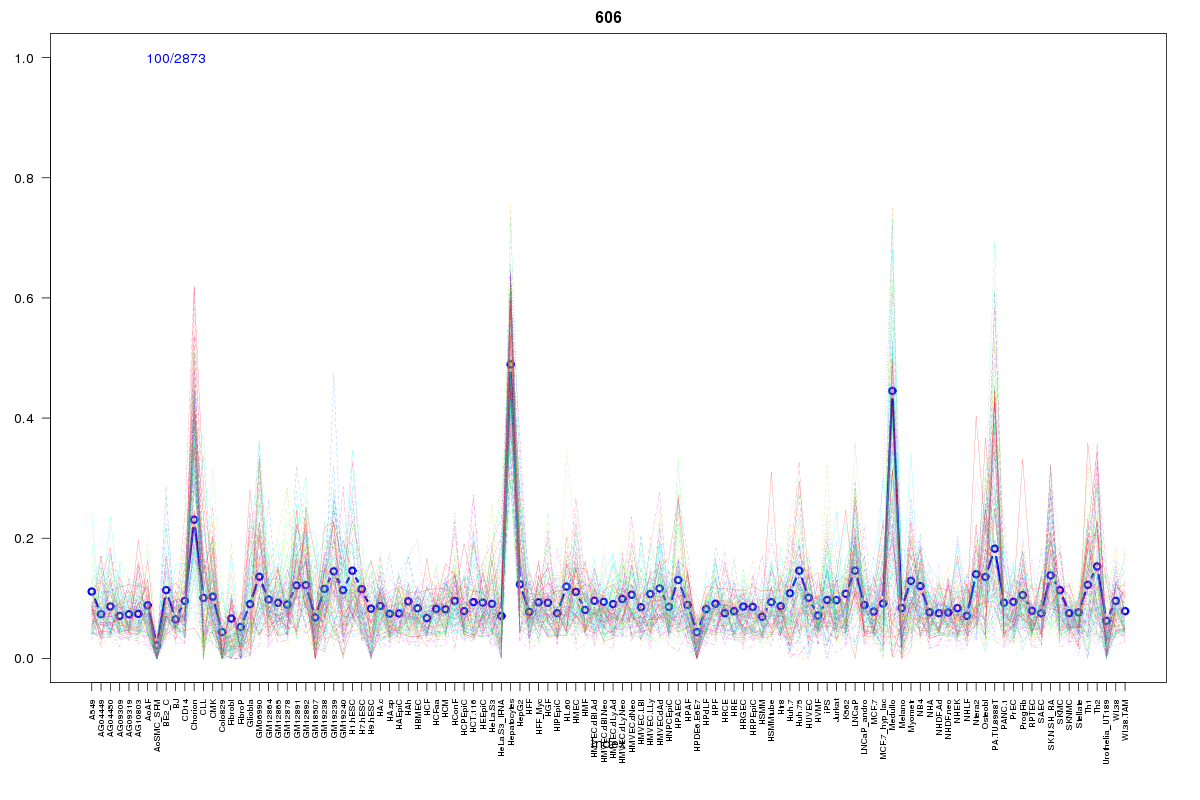 | 606 | 1 |
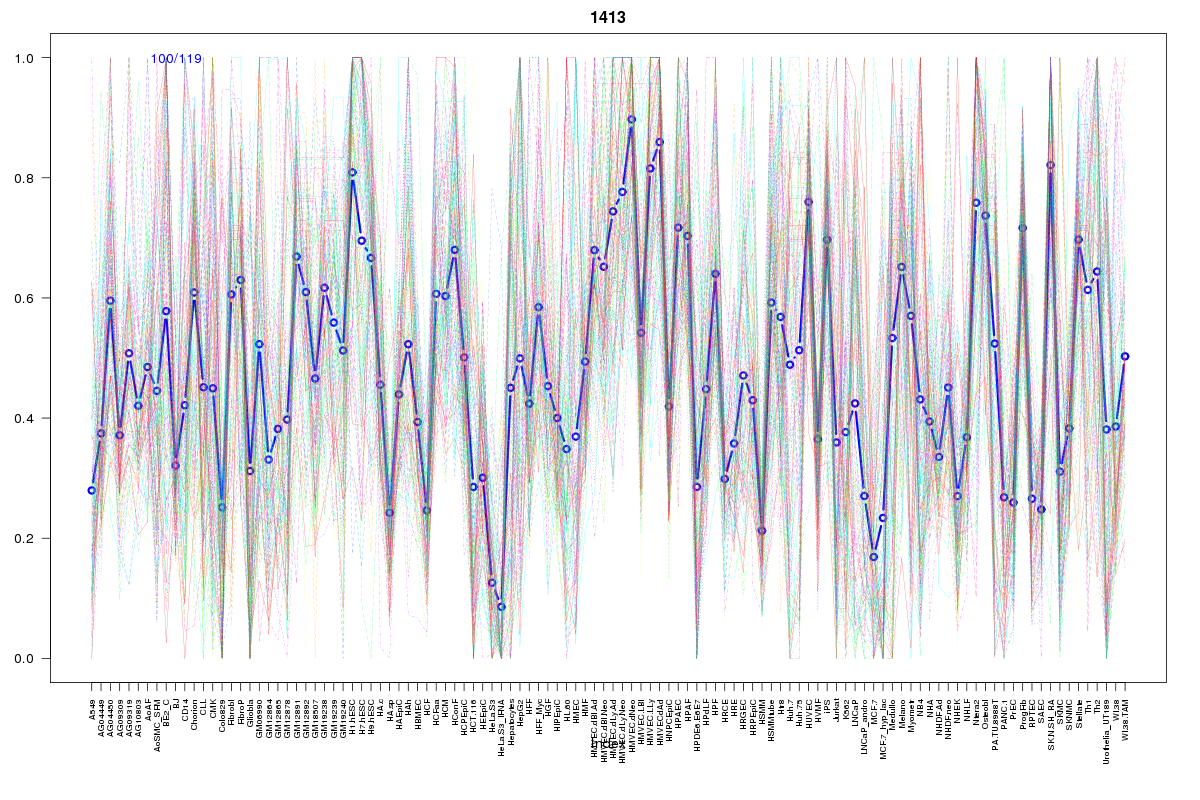 | 1413 | 1 |
 | 927 | 1 |
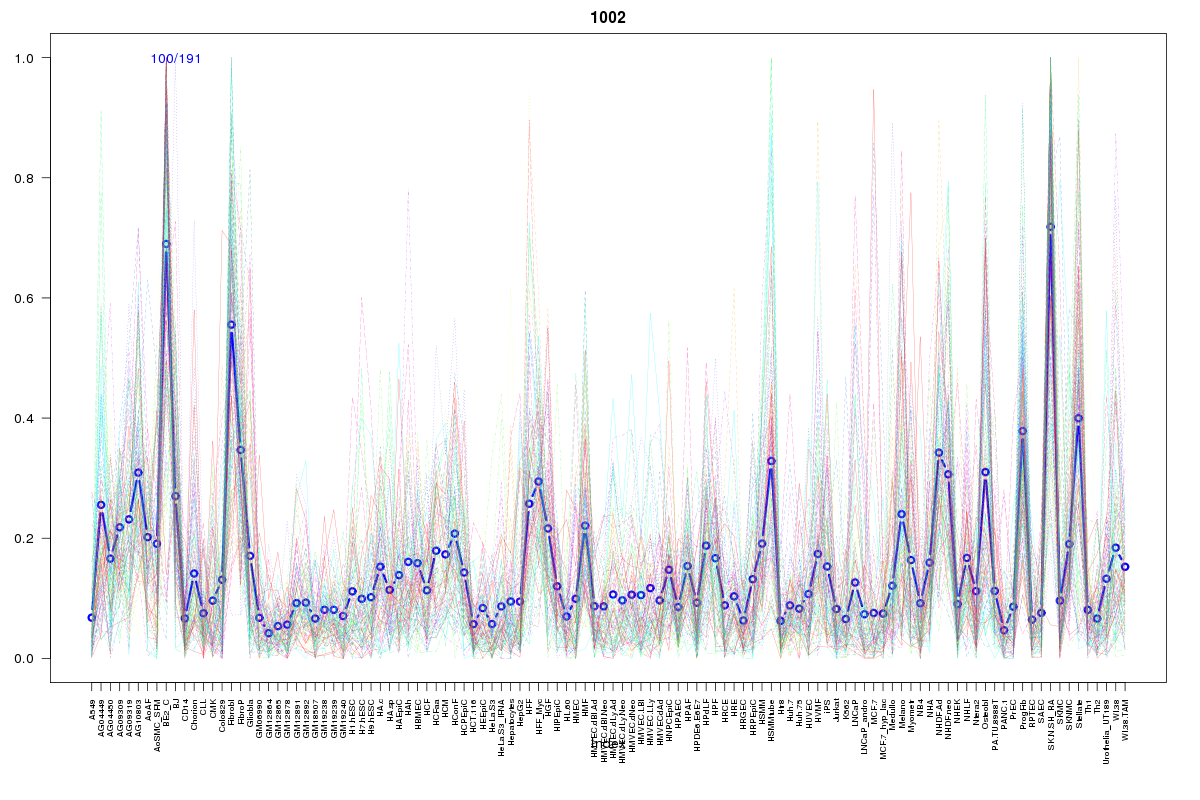 | 1002 | 1 |
 | 935 | 1 |
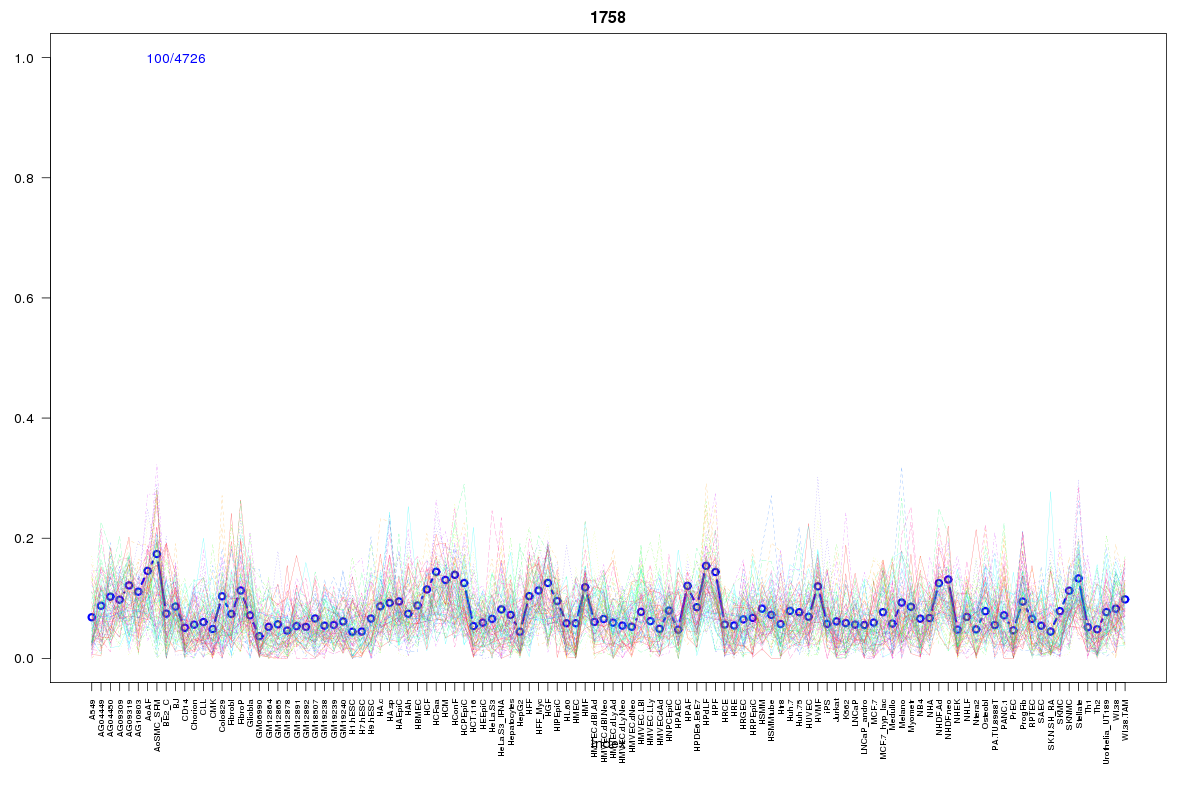 | 1758 | 1 |
 | 813 | 1 |
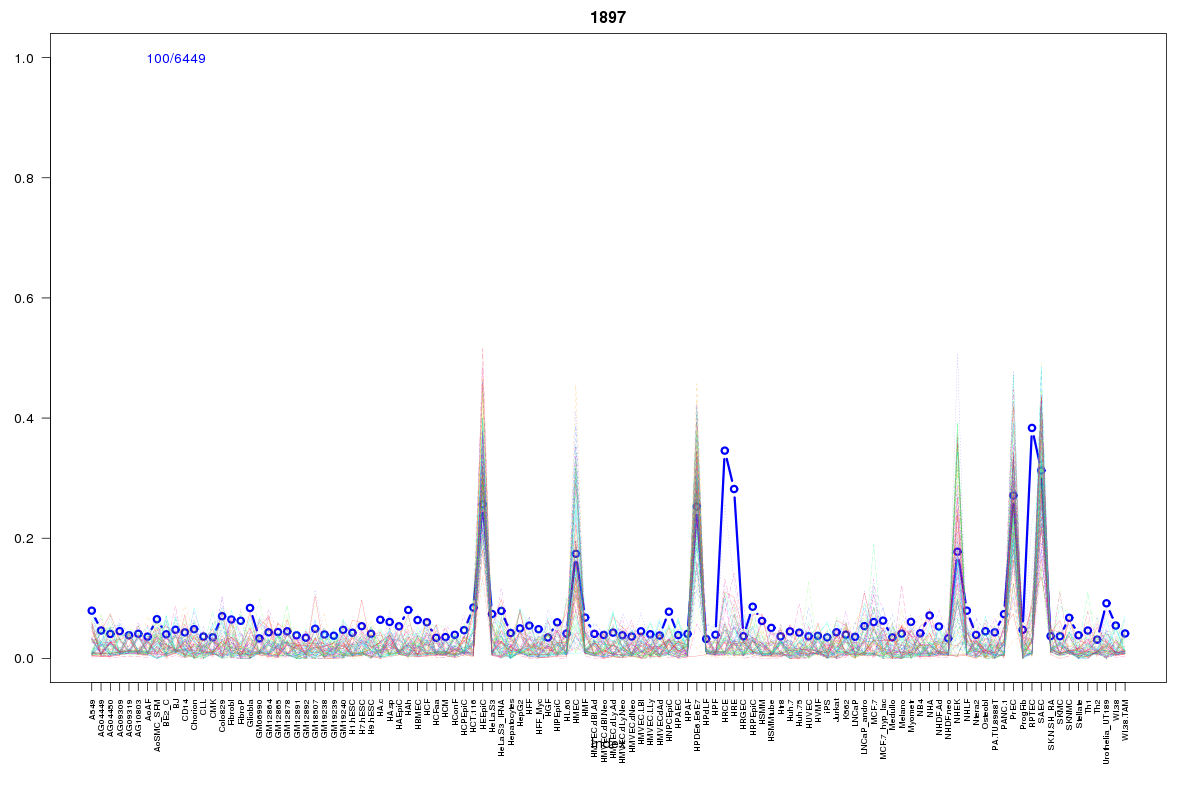 | 1897 | 1 |
 | 2052 | 1 |
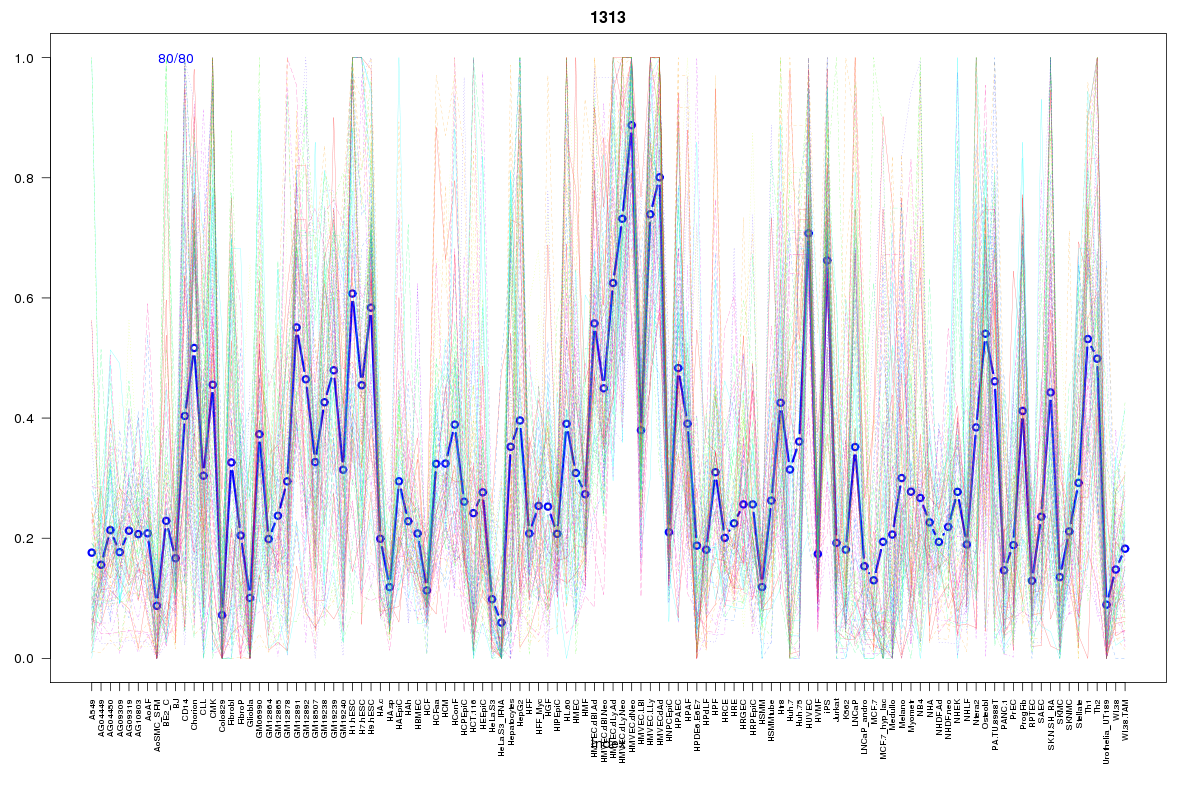 | 1313 | 1 |
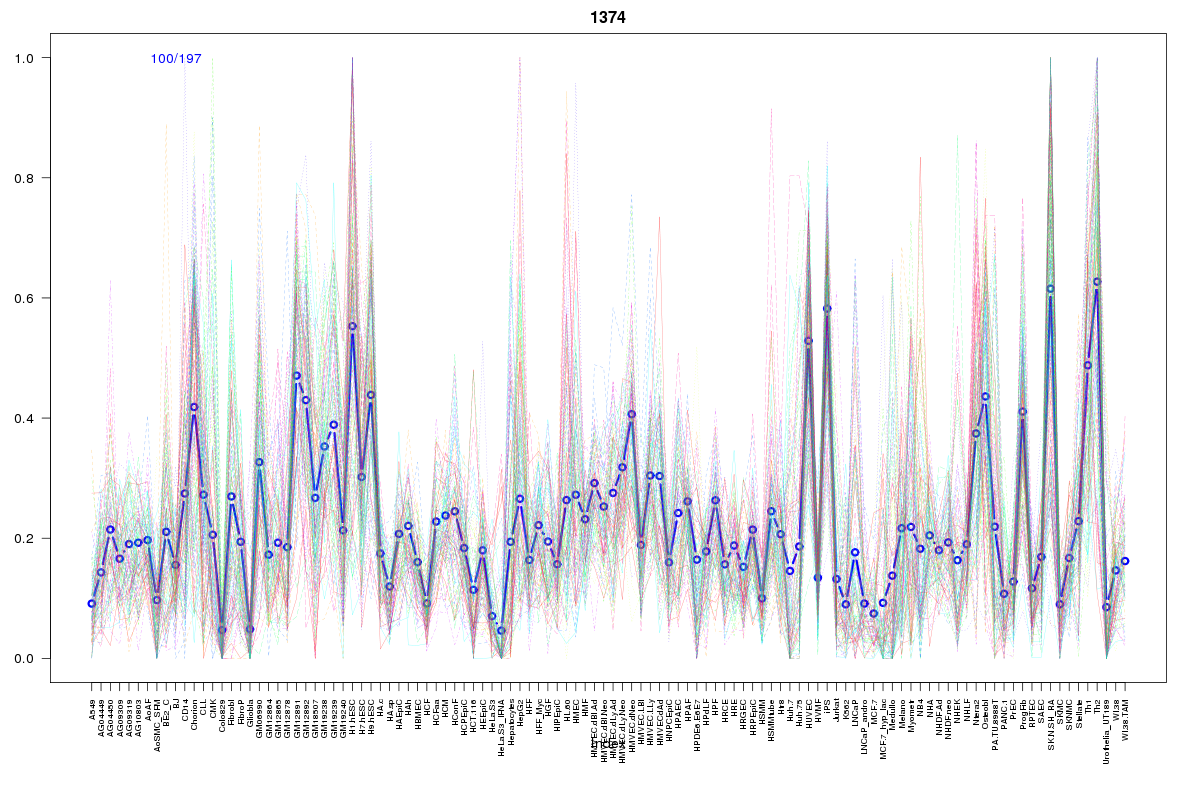 | 1374 | 1 |
 | 862 | 1 |
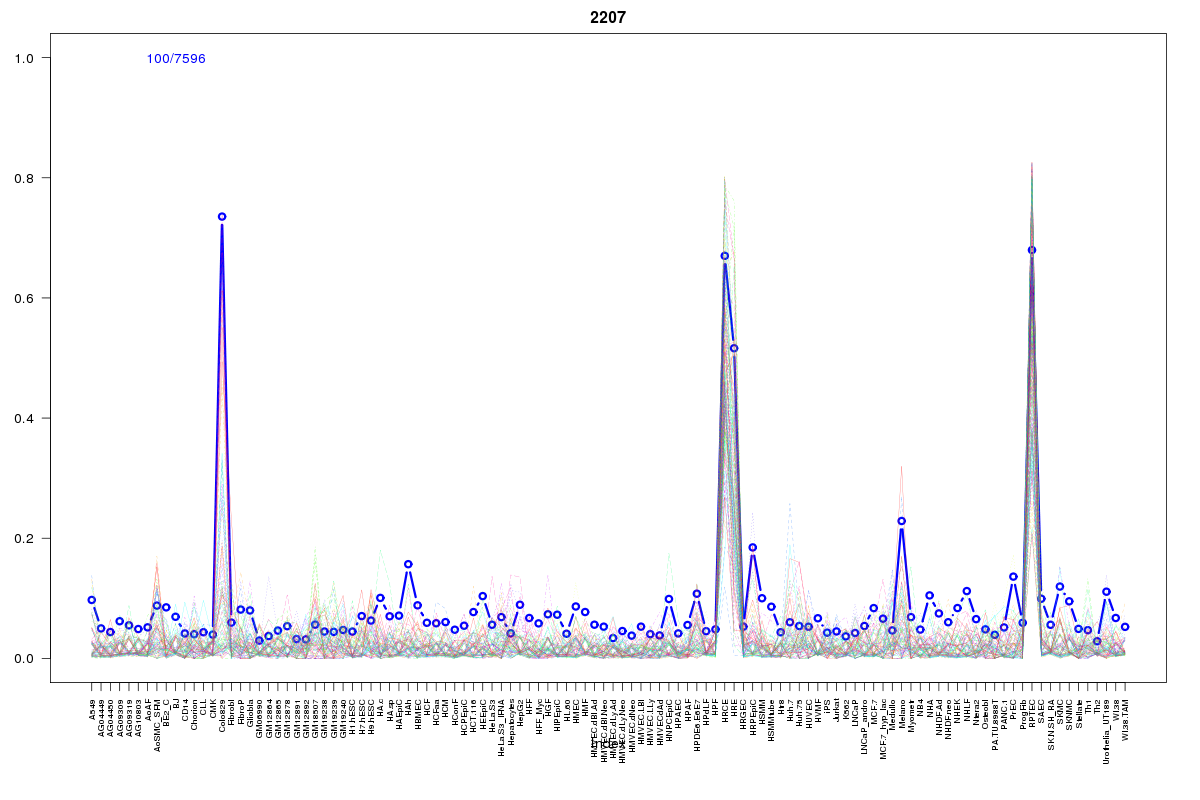 | 2207 | 1 |
Resources
BED file downloads
Connects to 16 DHS sitesTop 10 Correlated DHS Sites
p-values indiciate significant higher or lower correlation| Location | Cluster | P-value |
|---|---|---|
| chr3:52016225-52016375 | 2207 | 0 |
| chr3:52015740-52015890 | 862 | 0.001 |
| chr3:51921740-51921890 | 1897 | 0.01 |
| chr3:52093305-52093455 | 927 | 0.014 |
| chr3:52018405-52018555 | 606 | 0.02 |
| chr3:52016540-52016690 | 239 | 0.021 |
| chr3:52115320-52115470 | 813 | 0.022 |
| chr3:51990360-51990510 | 1374 | 0.023 |
| chr3:52102020-52102170 | 1002 | 0.023 |
| chr3:52111465-52111615 | 1758 | 0.023 |
| chr3:51984860-51985010 | 2052 | 0.013 |
External Databases
UCSCEnsembl (ENSG00000243989)