SOM cluster: 1002
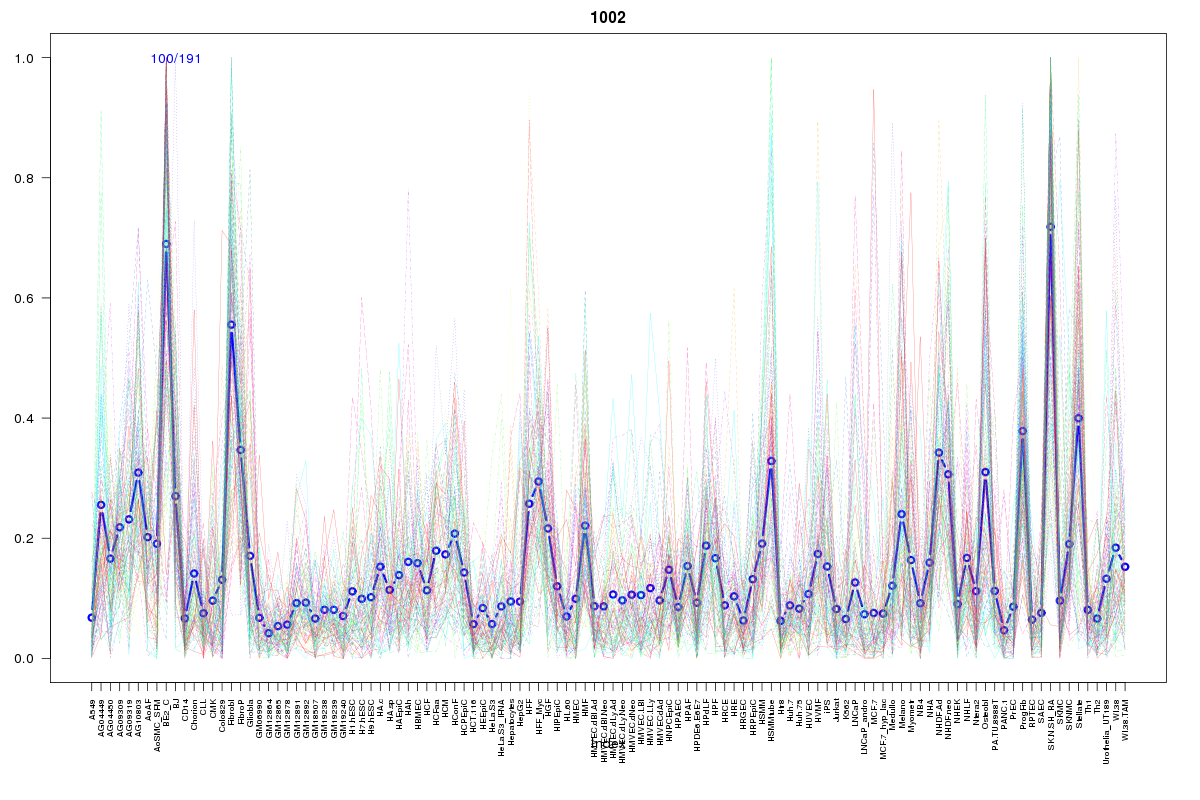
Cluster Hypersensitivity Profile

Genomic Location Trend
These plots show the distribution of the DHS sites surrounding the Transcript Start Site of the nearest gene.
Stats
Number of sites: 191Promoter: 2%
CpG-Island: 3%
Conserved: 48%
Enriched Motifs & Matches
Match Detail: [Jaspar]
|
| ||
|---|---|---|
| Sites: 55/100 | e-val: 1e-18 | ||
| Factor | e-val(match) | DB |
| SP1 | 0.00000071439 | JASPAR |
| Klf4 | 0.0035437 | JASPAR |
| Tal1::Gata1 | 0.011947 | JASPAR |
| TFAP2A | 0.012041 | JASPAR |
| INSM1 | 0.014778 | JASPAR |
|
| ||
| Sites: 38/100 | e-val: 0.000029 | ||
| Factor | e-val(match) | DB |
| EWSR1-FLI1 | 0.0000072754 | JASPAR |
| SP1 | 0.0042394 | JASPAR |
| TEAD1 | 0.0047862 | JASPAR |
| ZNF354C | 0.0050527 | JASPAR |
| Tal1::Gata1 | 0.013813 | JASPAR |
|
| ||
| Sites: 34/100 | e-val: 0.001 | ||
| Factor | e-val(match) | DB |
| CTCF | 0.00081486 | JASPAR |
| Zfx | 0.0020276 | JASPAR |
| Myf | 0.0021471 | JASPAR |
| PLAG1 | 0.0035212 | JASPAR |
| TFAP2A | 0.0053319 | JASPAR |