Gene: ADIPOR1P1
chr10: 22451920-22454723Expression Profile
(log scale)
Graphical Connections
Distribution of linked clusters:
You may find it interesting if many of the connected DHS sites belong to the same cluster.| Cluster Profile | Cluster ID | Number of DHS sites in this cluster |
|---|---|---|
 | 15 | 2 |
 | 2059 | 2 |
 | 2457 | 2 |
 | 927 | 1 |
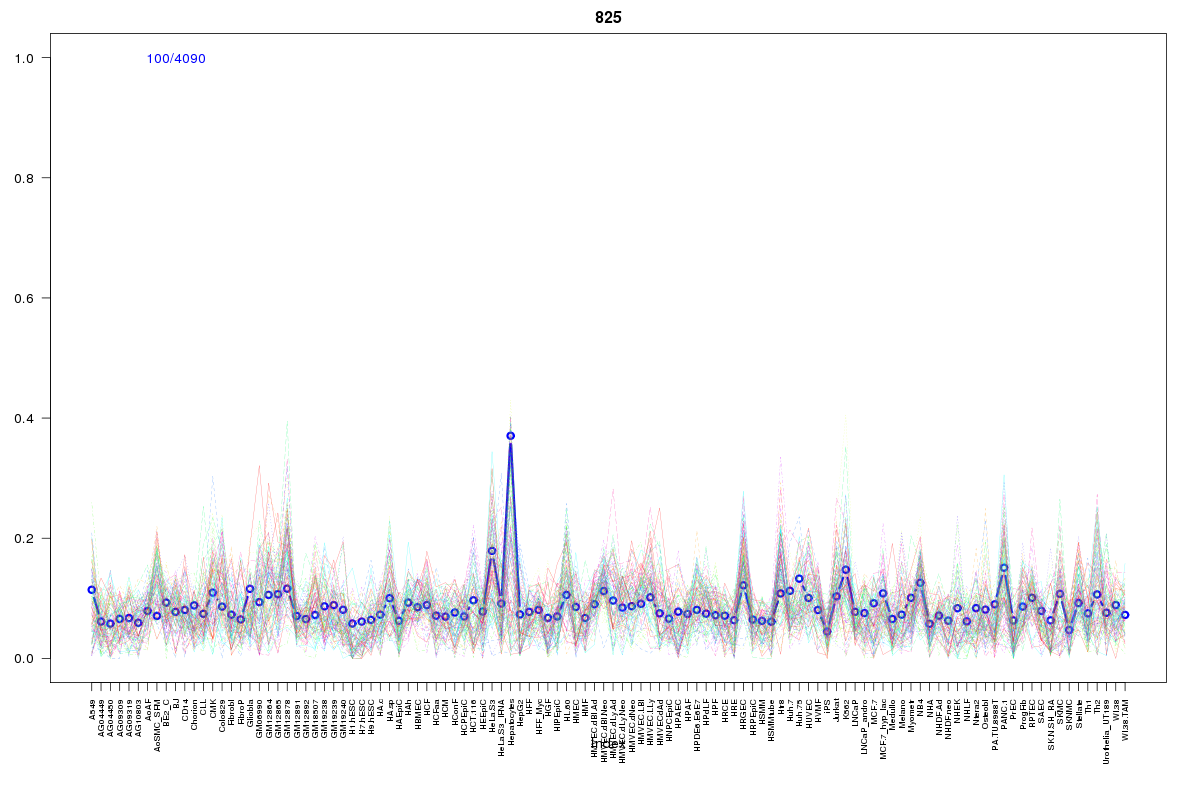 | 825 | 1 |
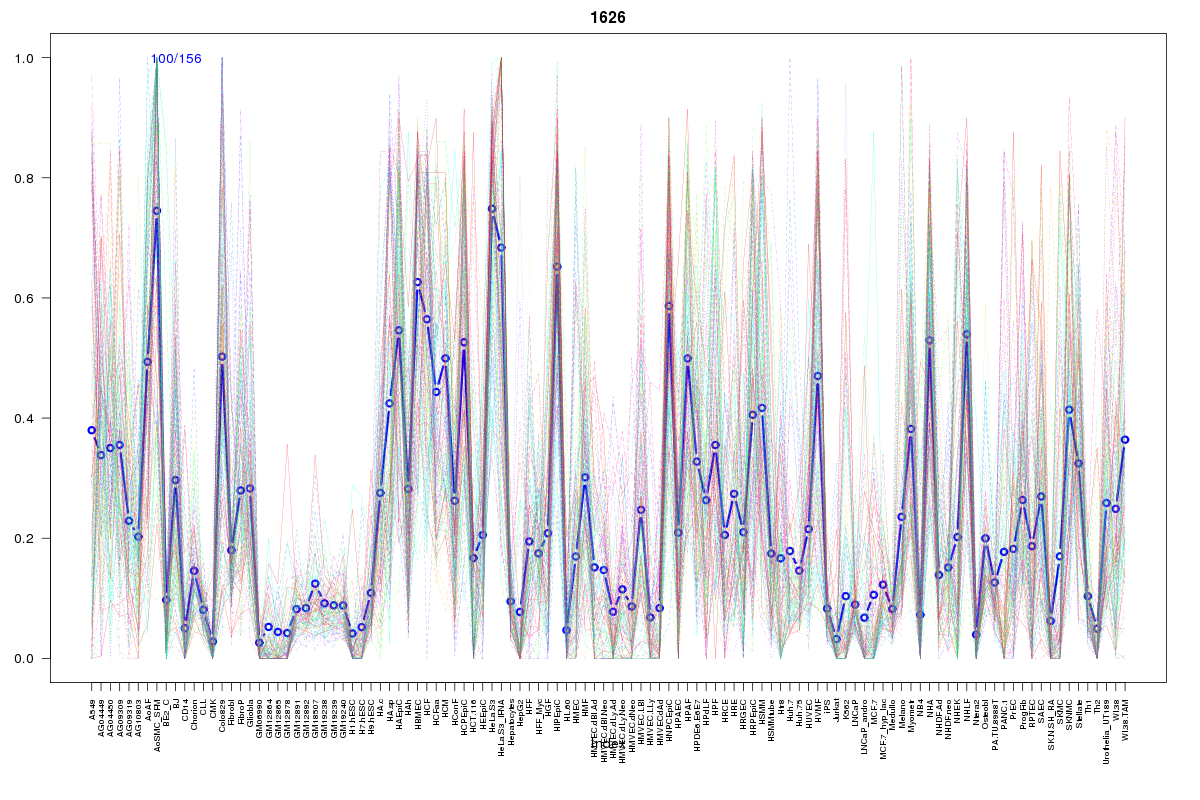 | 1626 | 1 |
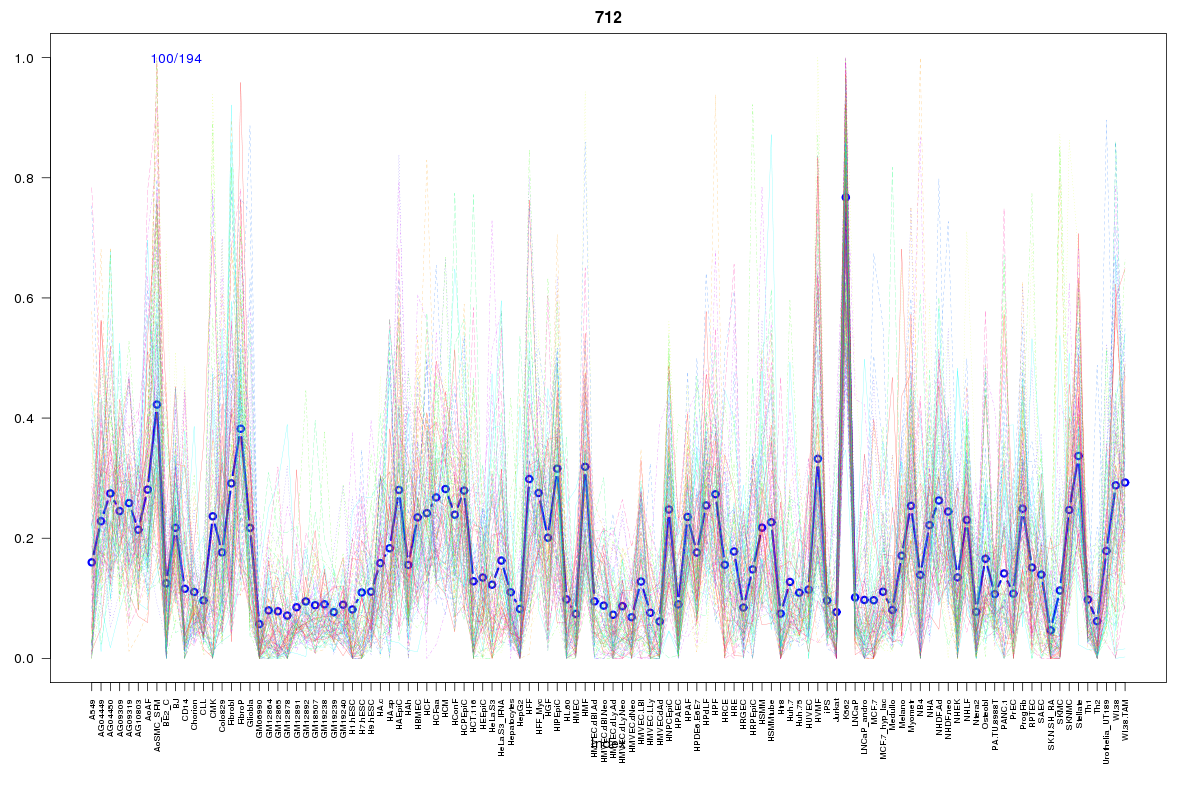 | 712 | 1 |
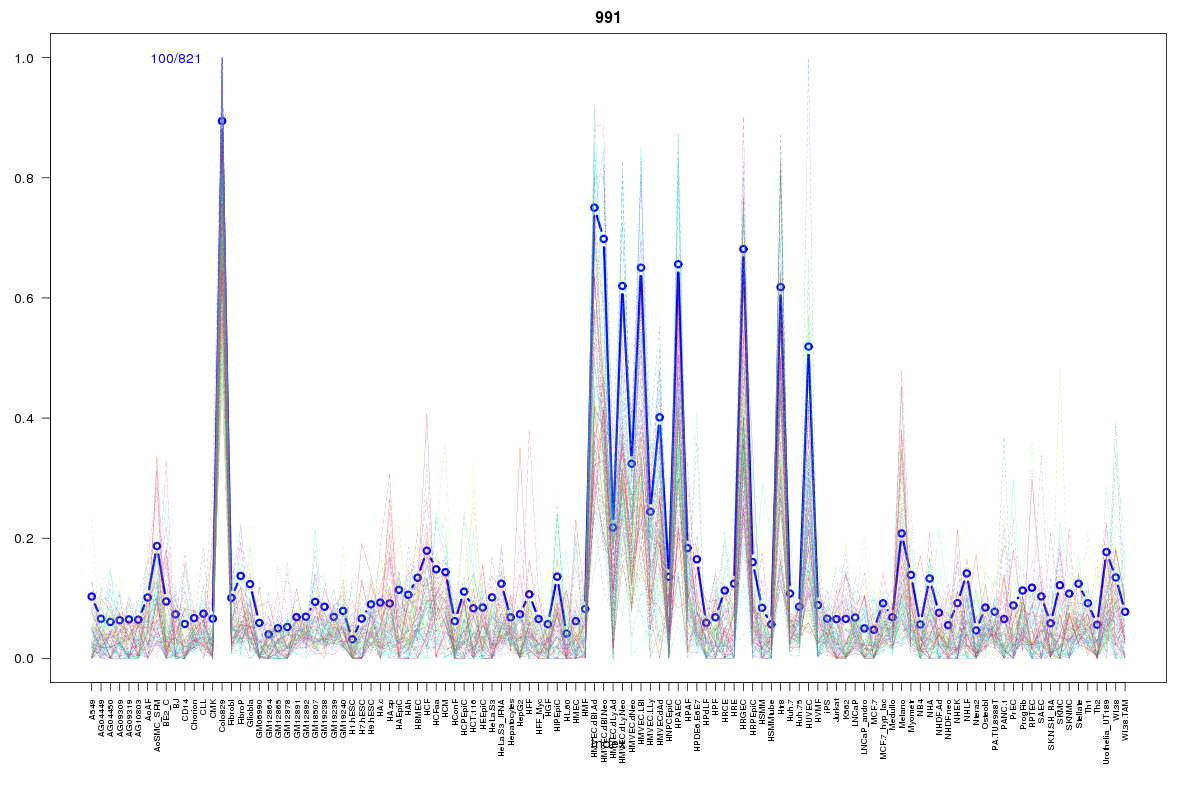 | 991 | 1 |
Resources
BED file downloads
Connects to 11 DHS sitesTop 10 Correlated DHS Sites
p-values indiciate significant higher or lower correlation| Location | Cluster | P-value |
|---|---|---|
| chr10:22457740-22457890 | 15 | 0.002 |
| chr10:22448180-22448330 | 15 | 0.024 |
| chr10:22540460-22540610 | 2059 | 0.02 |
| chr10:22517625-22517775 | 927 | 0.017 |
| chr10:22376180-22376330 | 712 | 0.016 |
| chr10:22438000-22438150 | 991 | 0.011 |
| chr10:22519300-22519450 | 2059 | 0.009 |
| chr10:22535740-22536030 | 2457 | 0.006 |
| chr10:22536040-22536190 | 1626 | 0.006 |
| chr10:22518825-22518975 | 825 | 0.006 |
| chr10:22535540-22535690 | 2457 | 0.002 |
External Databases
UCSCEnsembl (ENSG00000232497)