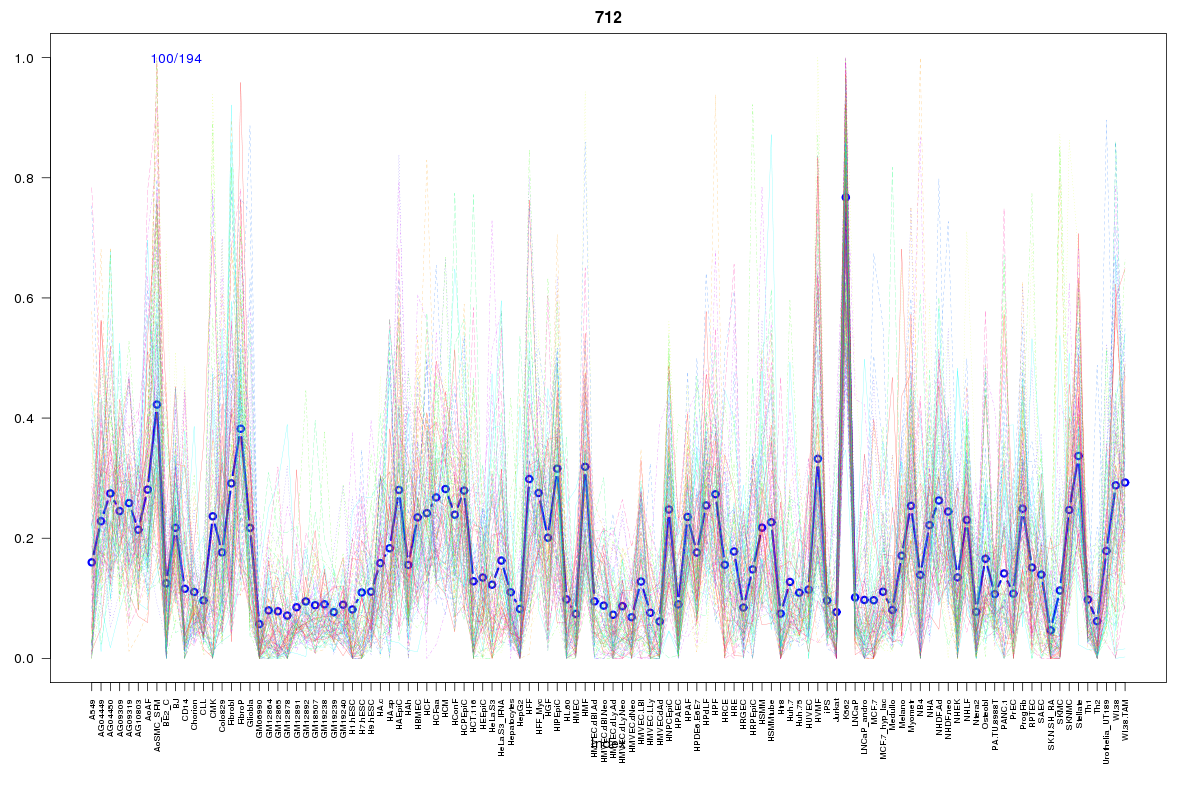
SOM cluster: 712
Cluster Hypersensitivity Profile

Genomic Location Trend
These plots show the distribution of the DHS sites surrounding the Transcript Start Site of the nearest gene.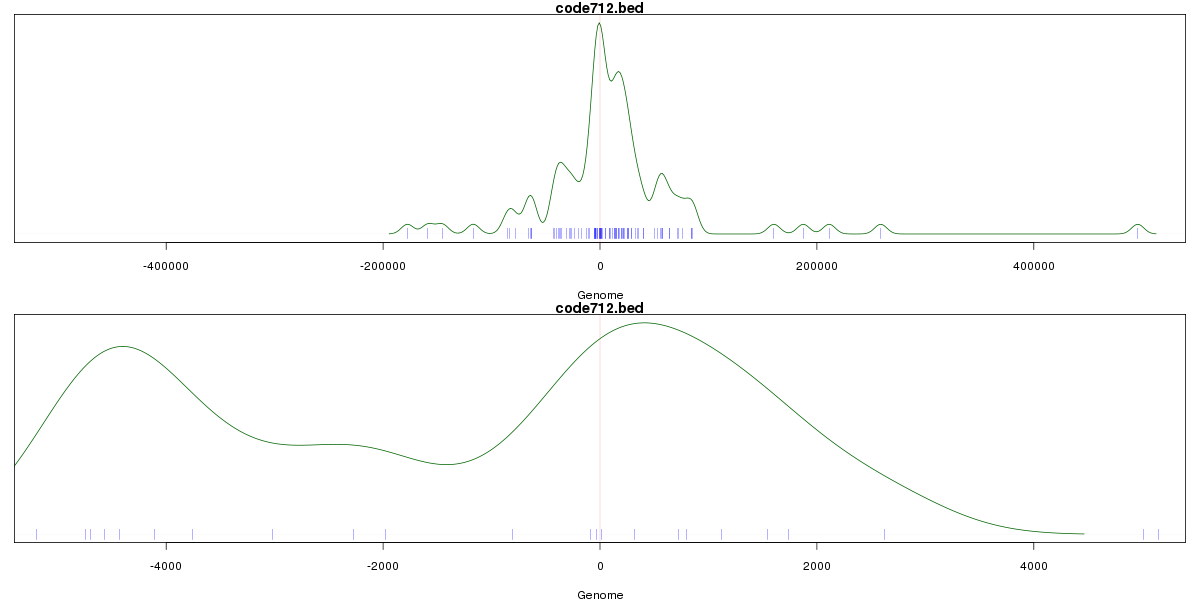
Stats
Number of sites: 194Promoter: 4%
CpG-Island: 0%
Conserved: 32%
Enriched Motifs & Matches
Match Detail: [Jaspar]
|
| ||
|---|---|---|
| Sites: 17/100 | e-val: 0.00001 | ||
| Factor | e-val(match) | DB |
| NFE2L2 | 0 | JASPAR |
| AP1 | 0.0000000074745 | JASPAR |
| NFE2L1::MafG | 0.00074478 | JASPAR |
| Mafb | 0.0053543 | JASPAR |
| PBX1 | 0.019352 | JASPAR |
BED file downloads
Top 10 Example Regions
| Location | Gene Link | Dist. |
|---|---|---|
| chr17: 74712720-74712870 | MFSD11 | 57.21 |
| chr1: 109841280-109841430 | SORT1 | 57.76 |
| chr12: 49502985-49503135 | RHEBL1 | 59.76 |
| chr12: 49502985-49503135 | PRKAG1 | 59.76 |
| chr2: 62729040-62729190 | TMEM17 | 61.17 |
| chr16: 11198700-11198850 | CLEC16A | 66.24 |
| chr8: 126459340-126459490 | TRIB1 | 68.58 |
| chr20: 49308080-49308230 | FAM65C | 80.58 |
| chr3: 178816460-178816610 | PIK3CA | 80.85 |
| chr1: 110262040-110262190 | RP5-1160K1.6 | 81.36 |