SOM cluster: 1626
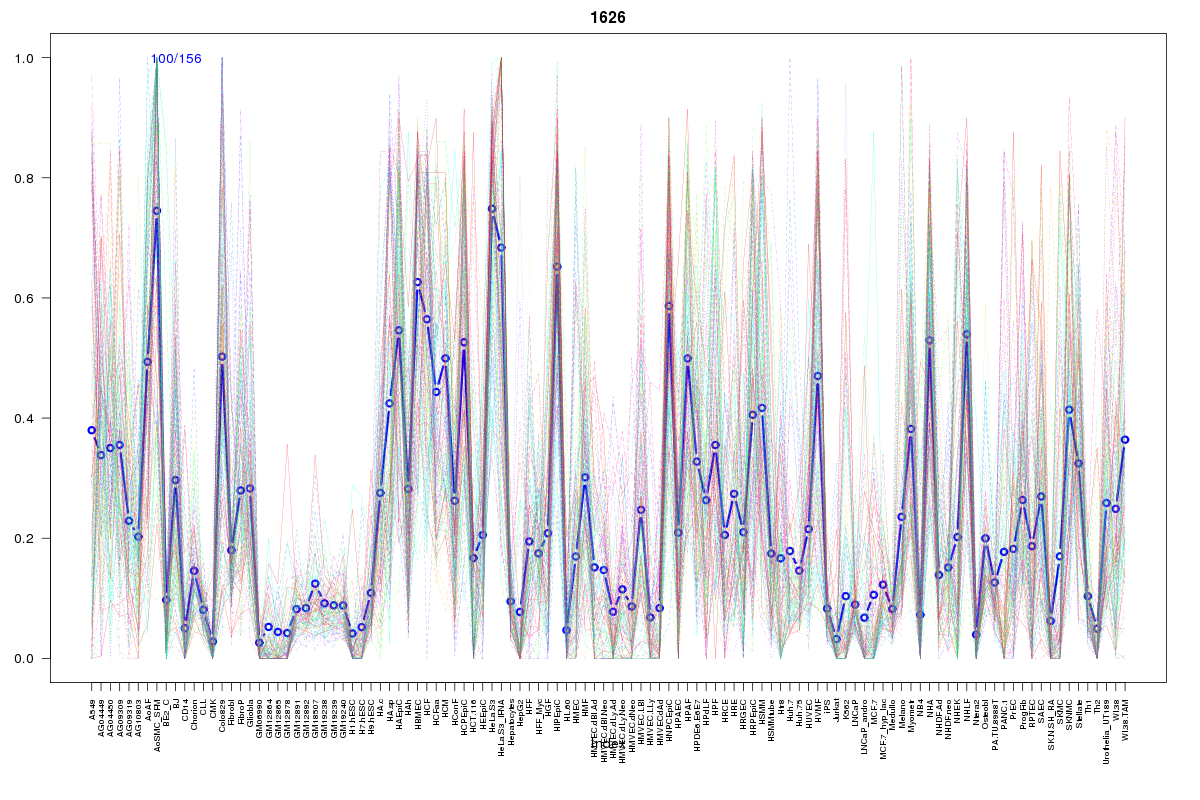
Cluster Hypersensitivity Profile

Genomic Location Trend
These plots show the distribution of the DHS sites surrounding the Transcript Start Site of the nearest gene.
Stats
Number of sites: 156Promoter: 1%
CpG-Island: 0%
Conserved: 30%
Enriched Motifs & Matches
Match Detail: [Jaspar]
|
| ||
|---|---|---|
| Sites: 38/100 | e-val: 0.00000022 | ||
| Factor | e-val(match) | DB |
| AP1 | 0.000000015319 | JASPAR |
| NFE2L2 | 0.0000083983 | JASPAR |
| NFE2L1::MafG | 0.0010523 | JASPAR |
| FEV | 0.014088 | JASPAR |
| SPI1 | 0.016328 | JASPAR |
BED file downloads
Top 10 Example Regions
| Location | Gene Link | Dist. |
|---|---|---|
| chr8: 122709700-122709850 | HAS2 | 40.31 |
| chr1: 41410025-41410175 | SCMH1 | 45.77 |
| chr1: 41410025-41410175 | UBE2V1P8 | 45.77 |
| chr1: 172325880-172326030 | C1orf105 | 53.02 |
| chr3: 30269425-30269575 | U3 | 55.47 |
| chr3: 43764720-43764870 | ABHD5 | 55.65 |
| chr3: 43764720-43764870 | RP4-672N11.1 | 55.65 |
| chrX: 134082860-134083010 | MOSPD1 | 63.31 |
| chrX: 134082860-134083010 | SMIM10 | 63.31 |
| chrX: 16858360-16858510 | SYAP1 | 66.18 |