Gene: SLC30A2
chr1: 26363742-26372604Expression Profile
(log scale)
Graphical Connections
Distribution of linked clusters:
You may find it interesting if many of the connected DHS sites belong to the same cluster.| Cluster Profile | Cluster ID | Number of DHS sites in this cluster |
|---|---|---|
 | 862 | 7 |
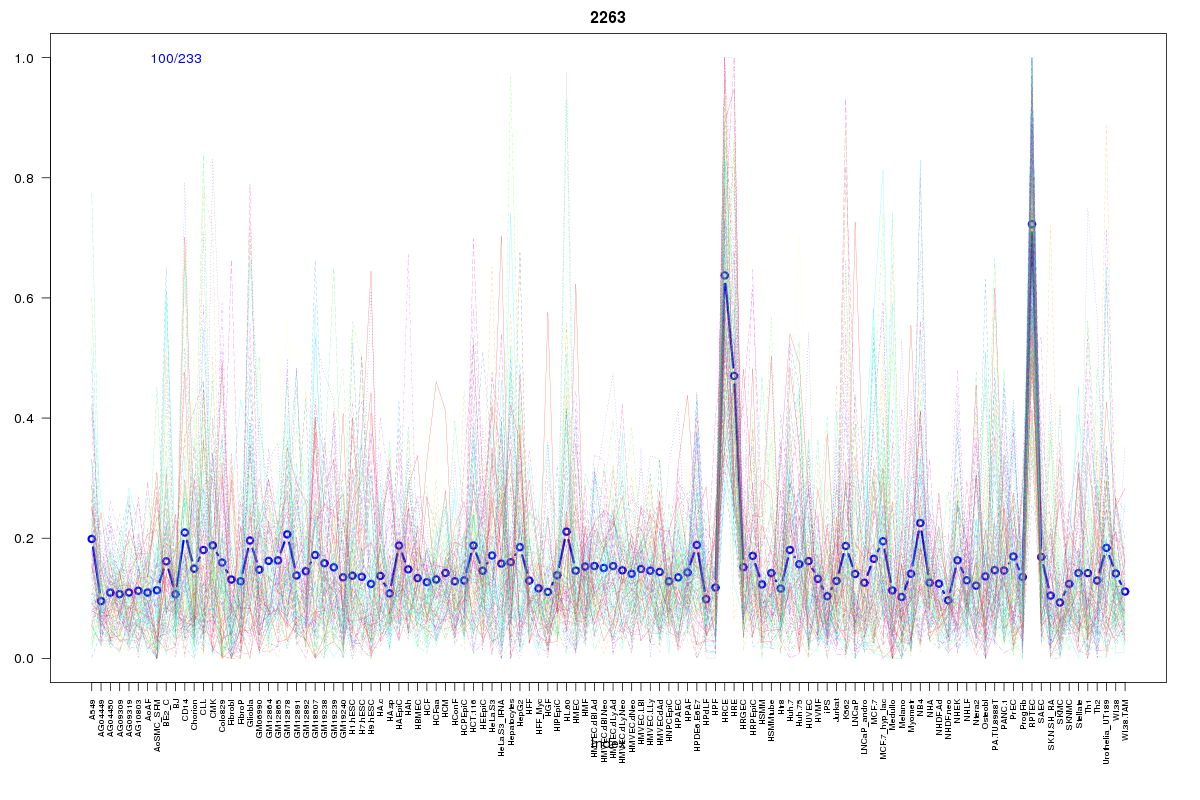 | 2263 | 2 |
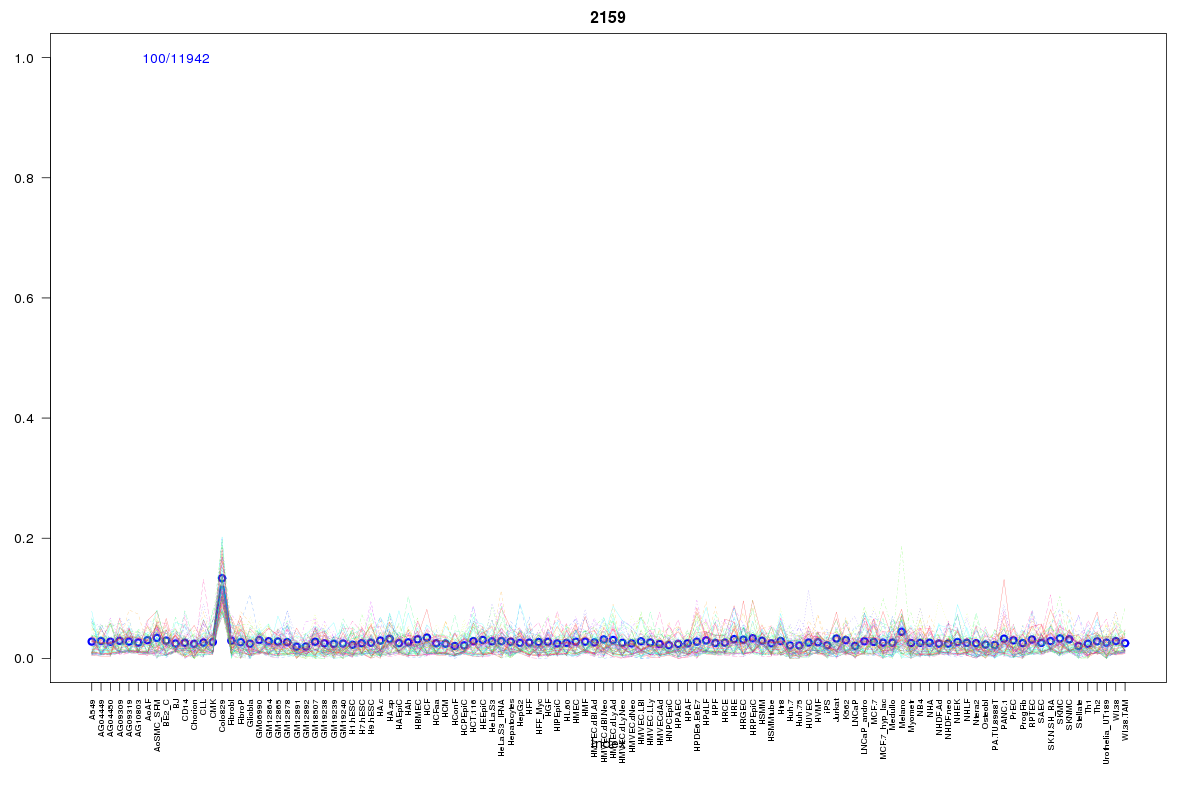 | 2159 | 1 |
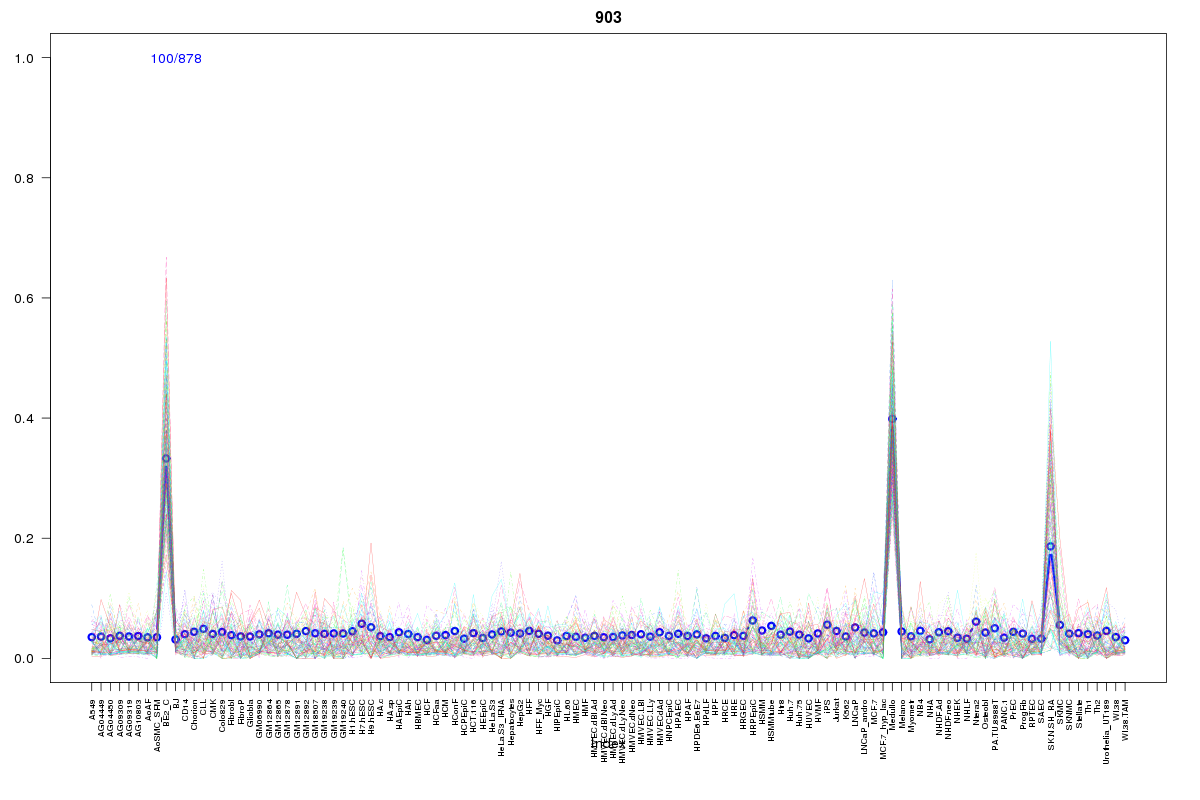 | 903 | 1 |
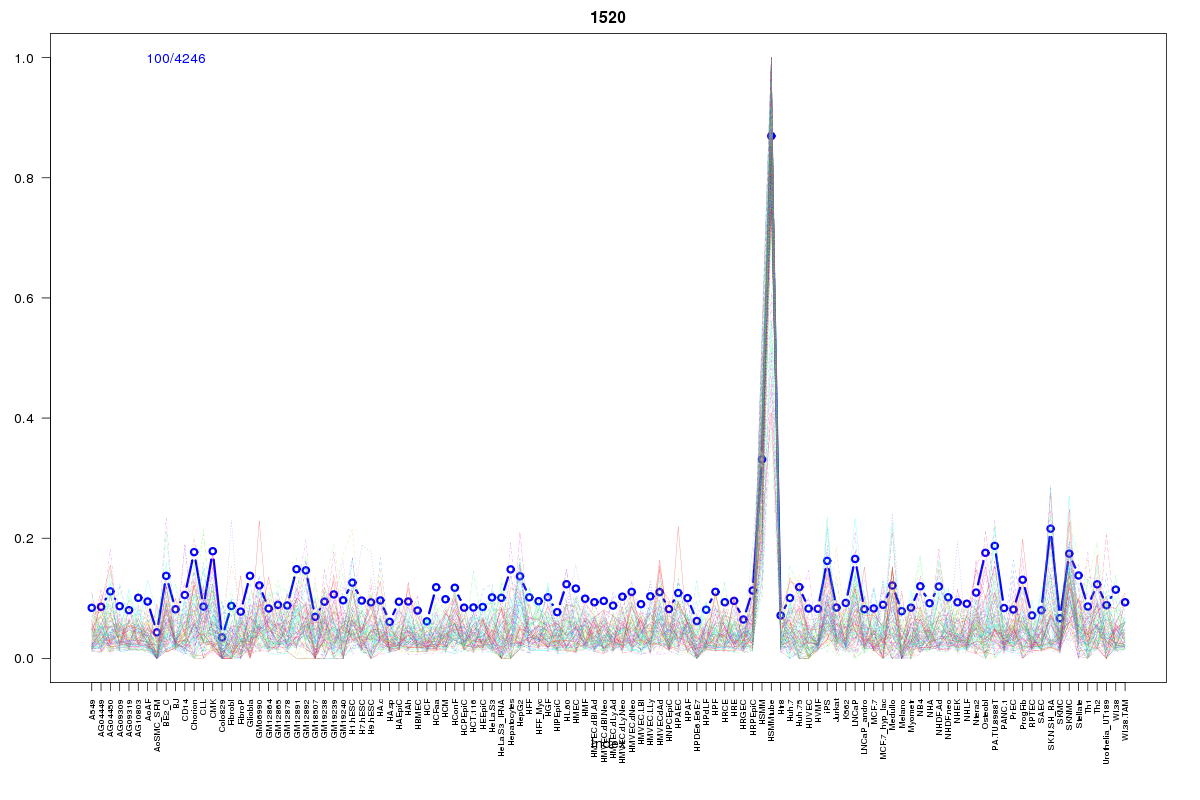 | 1520 | 1 |
 | 2122 | 1 |
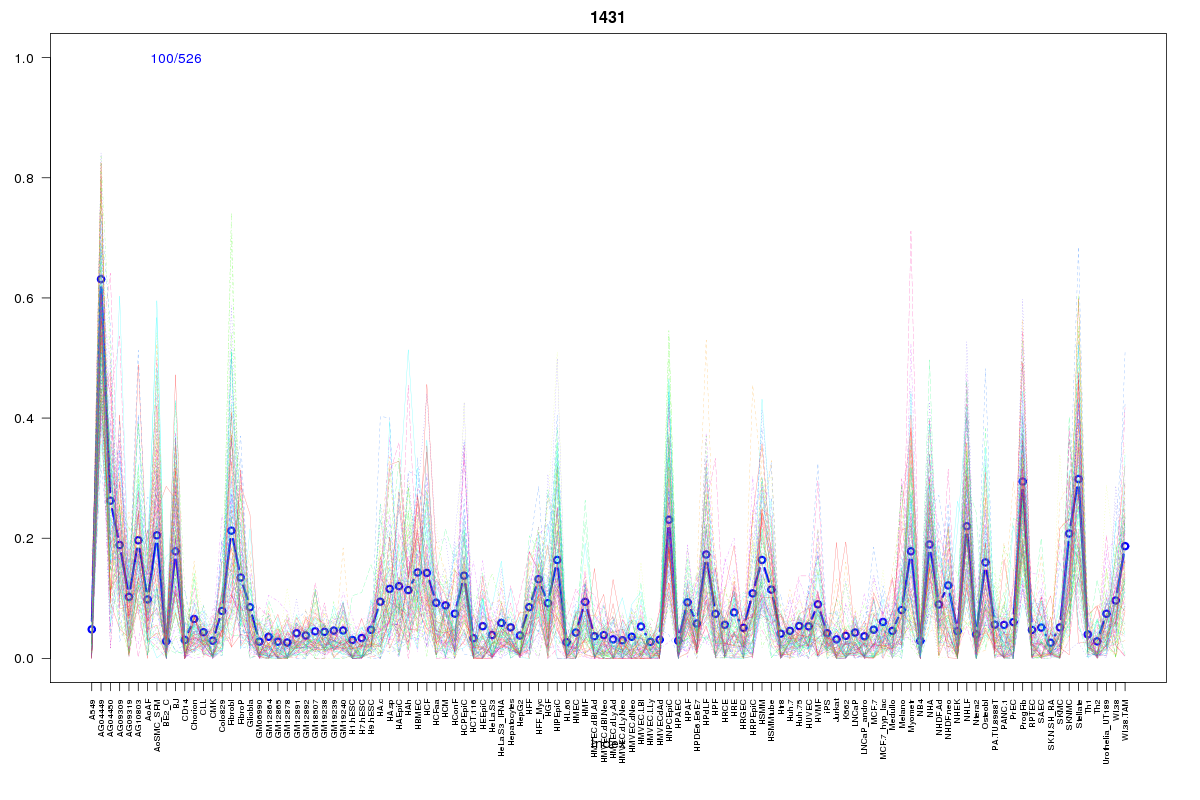 | 1431 | 1 |
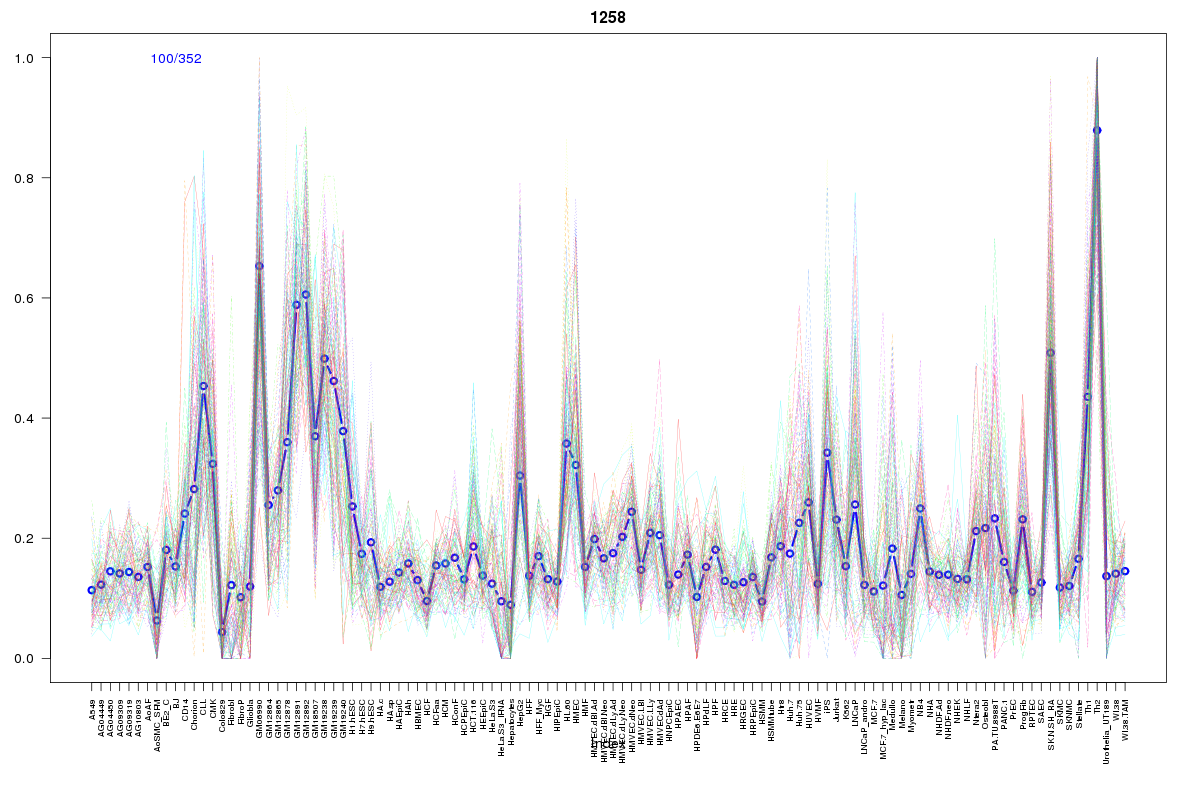 | 1258 | 1 |
 | 2055 | 1 |
 | 927 | 1 |
 | 1078 | 1 |
 | 2061 | 1 |
 | 860 | 1 |
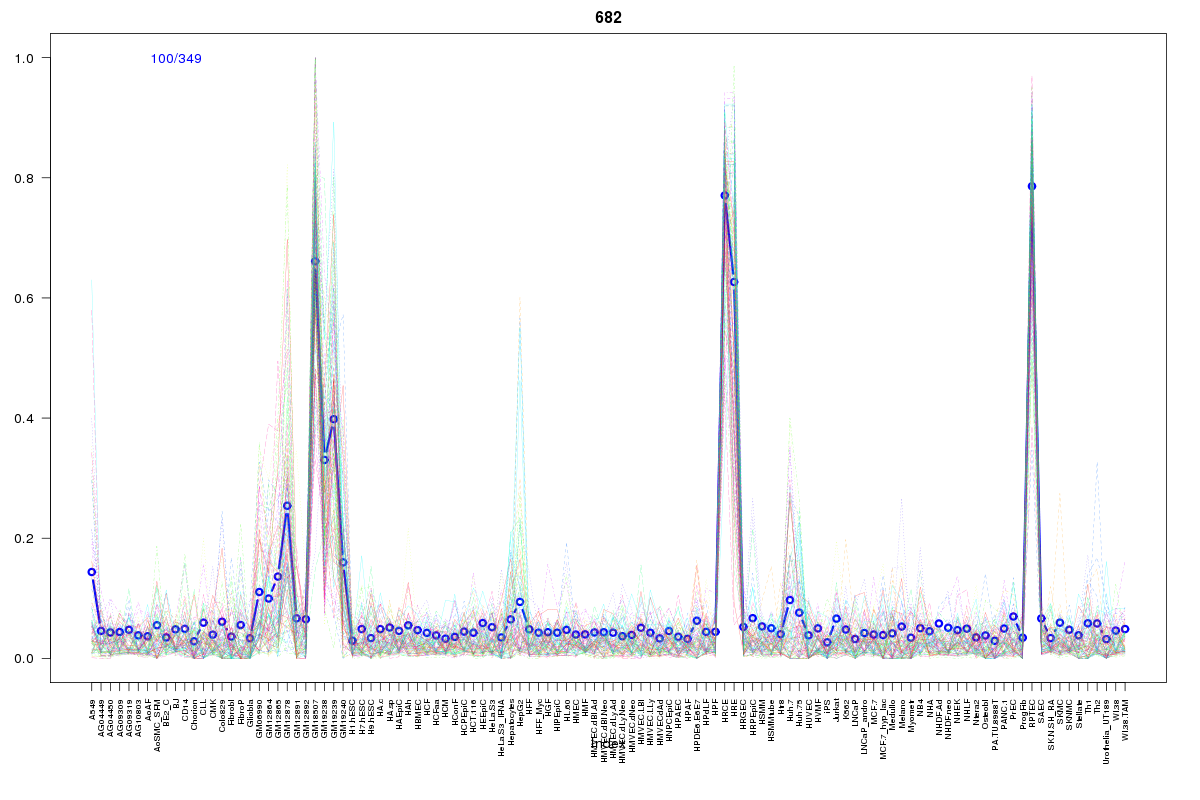 | 682 | 1 |
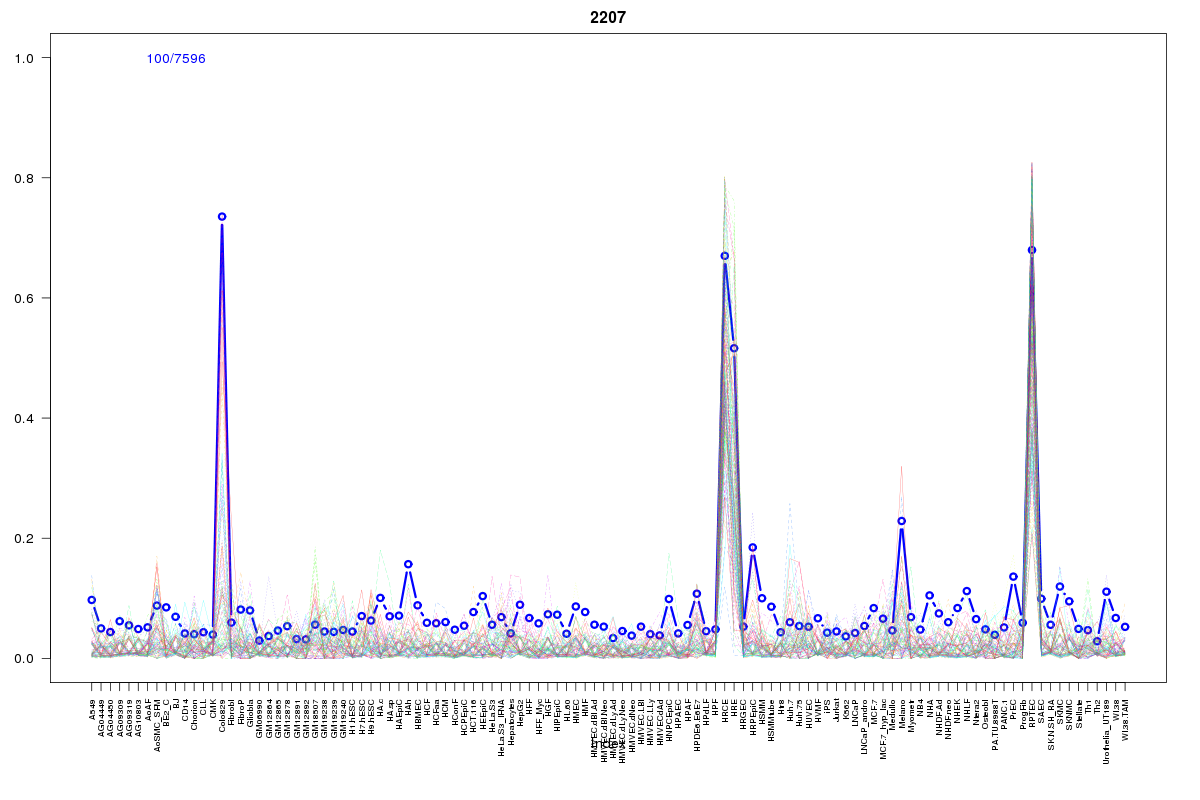 | 2207 | 1 |
Resources
BED file downloads
Connects to 22 DHS sitesTop 10 Correlated DHS Sites
p-values indiciate significant higher or lower correlation| Location | Cluster | P-value |
|---|---|---|
| chr1:26376025-26376175 | 862 | 0.003 |
| chr1:26391140-26391290 | 682 | 0.007 |
| chr1:26391305-26391455 | 2207 | 0.007 |
| chr1:26386260-26386410 | 862 | 0.008 |
| chr1:26425940-26426090 | 862 | 0.008 |
| chr1:26363080-26363230 | 2263 | 0.012 |
| chr1:26376380-26376530 | 2061 | 0.013 |
| chr1:26376205-26376355 | 862 | 0.013 |
| chr1:26363560-26363710 | 862 | 0.017 |
| chr1:26311800-26311950 | 862 | 0.017 |
| chr1:26408220-26408370 | 862 | 0.018 |
External Databases
UCSCEnsembl (ENSG00000158014)