SOM cluster: 682
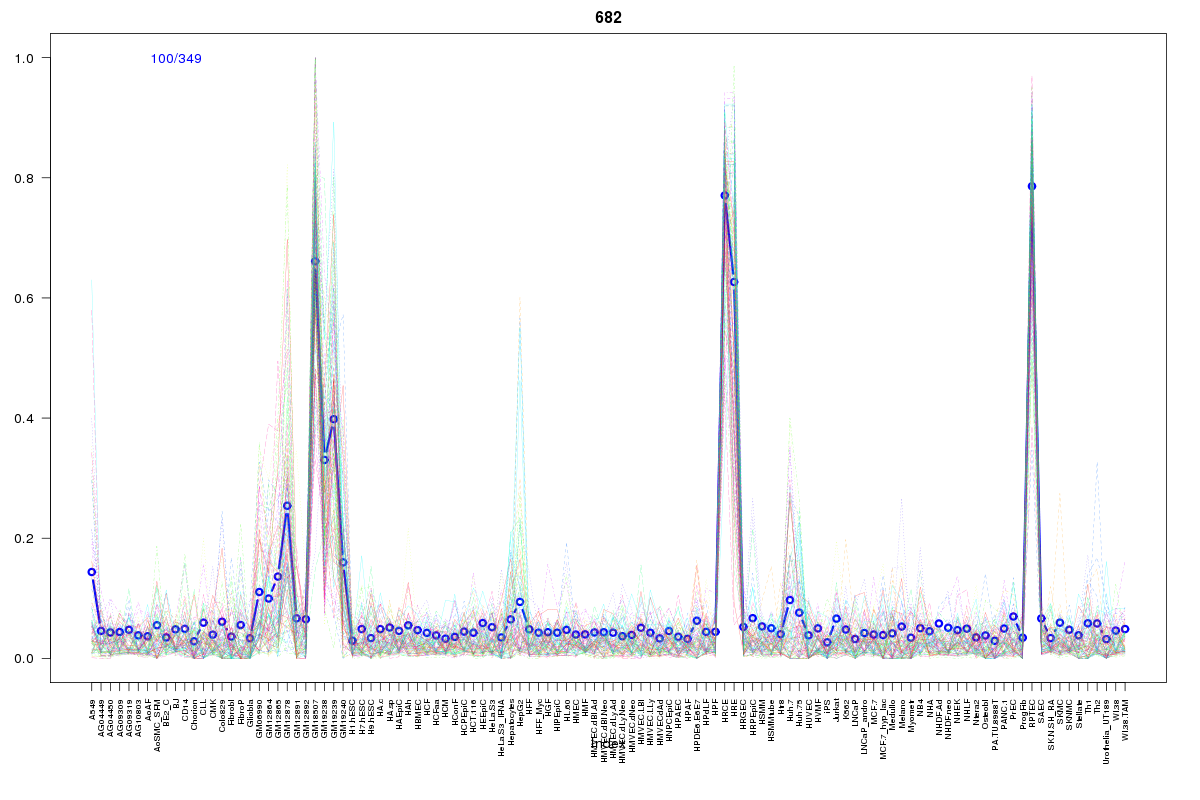
Cluster Hypersensitivity Profile

Genomic Location Trend
These plots show the distribution of the DHS sites surrounding the Transcript Start Site of the nearest gene.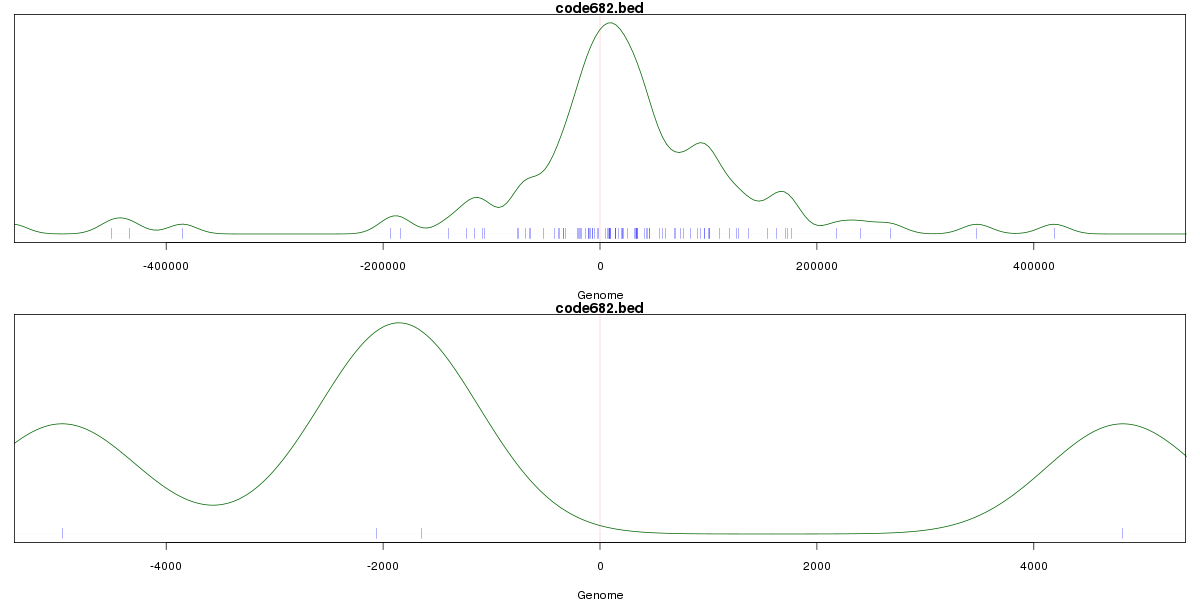
Stats
Number of sites: 349Promoter: 1%
CpG-Island: 0%
Conserved: 27%
Enriched Motifs & Matches
Match Detail: [Jaspar]
|
| ||
|---|---|---|
| Sites: 58/100 | e-val: 0 | ||
| Factor | e-val(match) | DB |
| HNF1A | 0 | JASPAR |
| HNF1B | 0.000000000000076605 | JASPAR |
| Lhx3 | 0.00000001051 | JASPAR |
| Prrx2 | 0.000068165 | JASPAR |
| NKX3-1 | 0.00085747 | JASPAR |
BED file downloads
Top 10 Example Regions
| Location | Gene Link | Dist. |
|---|---|---|
| chr7: 139529400-139529550 | TBXAS1 | 36.73 |
| chr8: 8707640-8707790 | MFHAS1 | 41.79 |
| chr13: 103783020-103783170 | SLC10A2 | 43.51 |
| chr1: 26391140-26391290 | SLC30A2 | 47.66 |
| chr6: 2188160-2188310 | GMDS-AS1 | 47.88 |
| chr6: 2188160-2188310 | GMDS | 47.88 |
| chr12: 12035320-12035470 | ETV6 | 53.65 |
| chr10: 98047240-98047390 | TLL2 | 55.85 |
| chr8: 103941760-103941910 | KB-1507C5.2 | 61.05 |
| chr20: 872520-872670 | ANGPT4 | 61.06 |