Gene: ATP5G2
chr12: 54026509-54062996Expression Profile
(log scale)
Graphical Connections
Distribution of linked clusters:
You may find it interesting if many of the connected DHS sites belong to the same cluster.| Cluster Profile | Cluster ID | Number of DHS sites in this cluster |
|---|---|---|
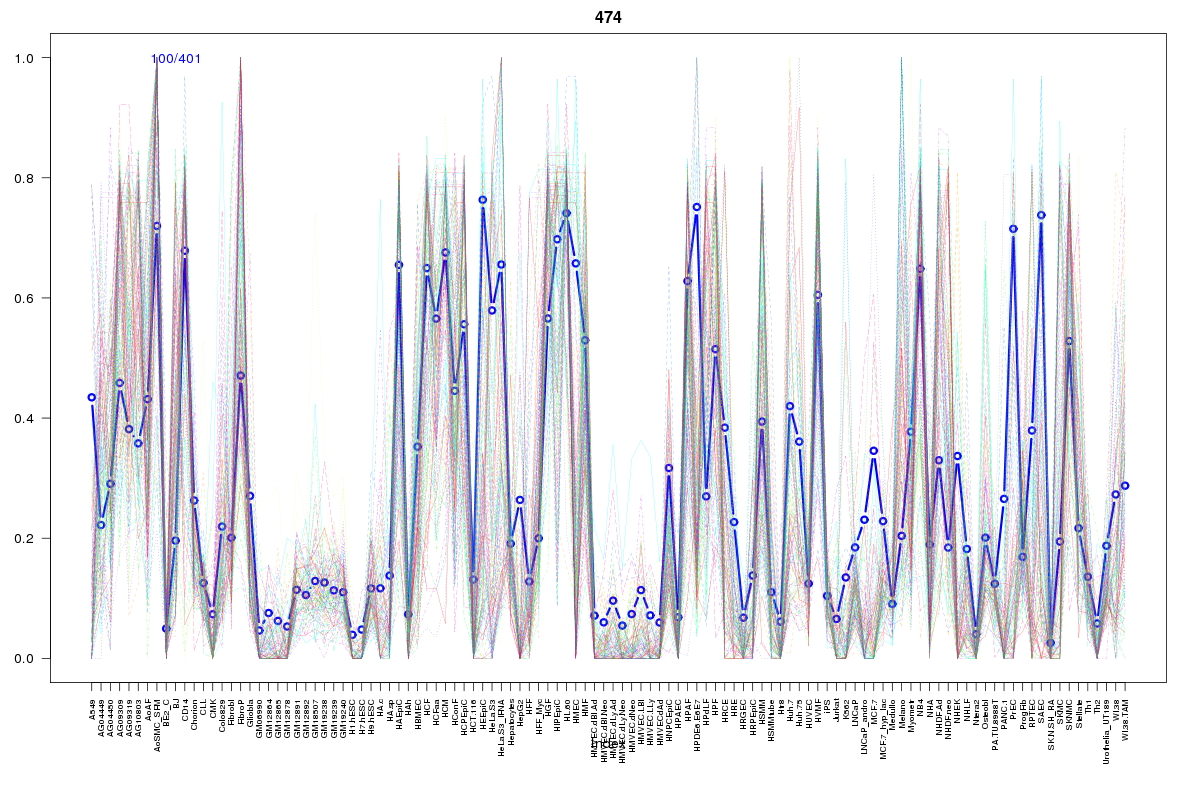 | 474 | 1 |
 | 15 | 1 |
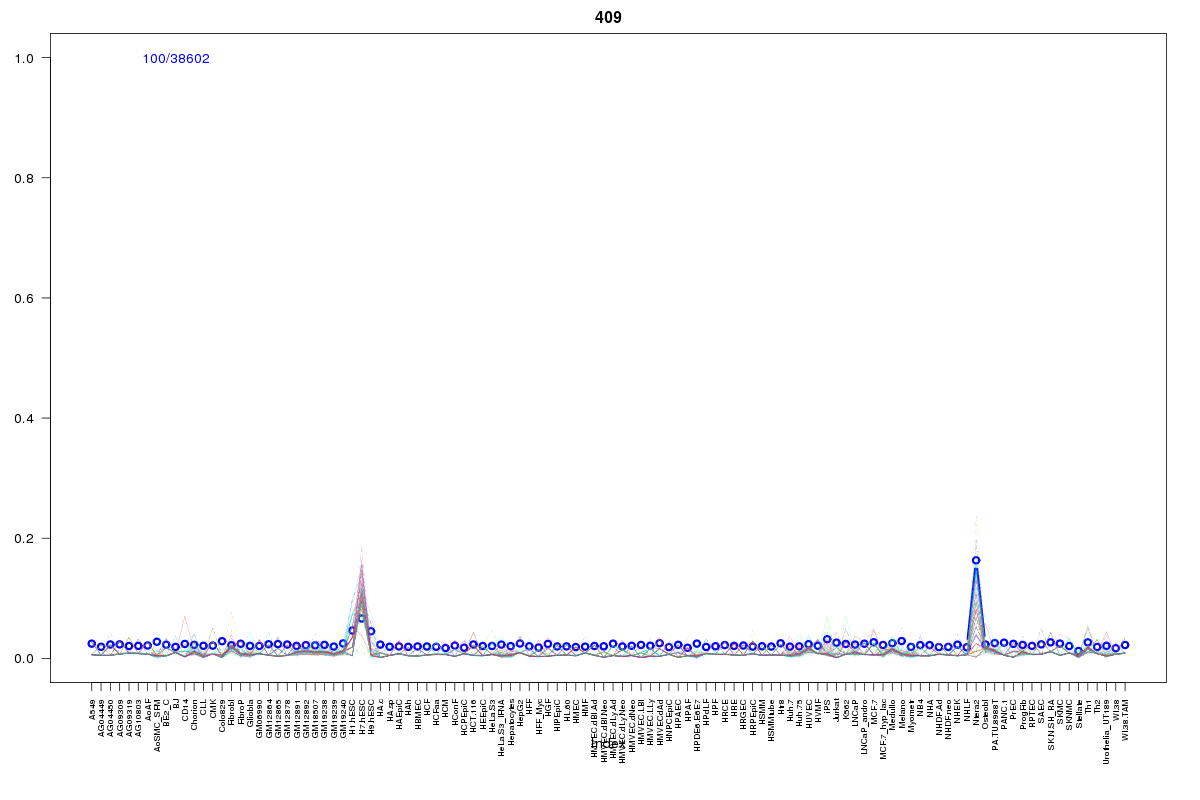 | 409 | 1 |
 | 1605 | 1 |
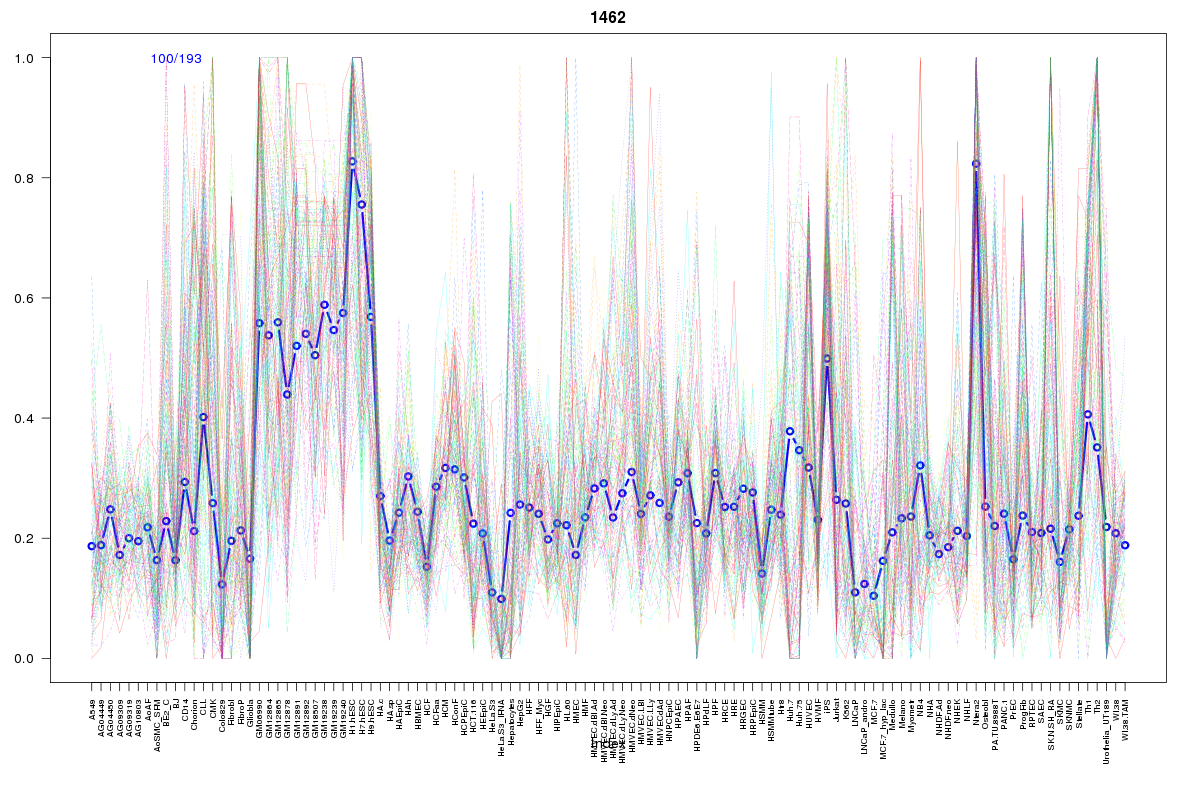 | 1462 | 1 |
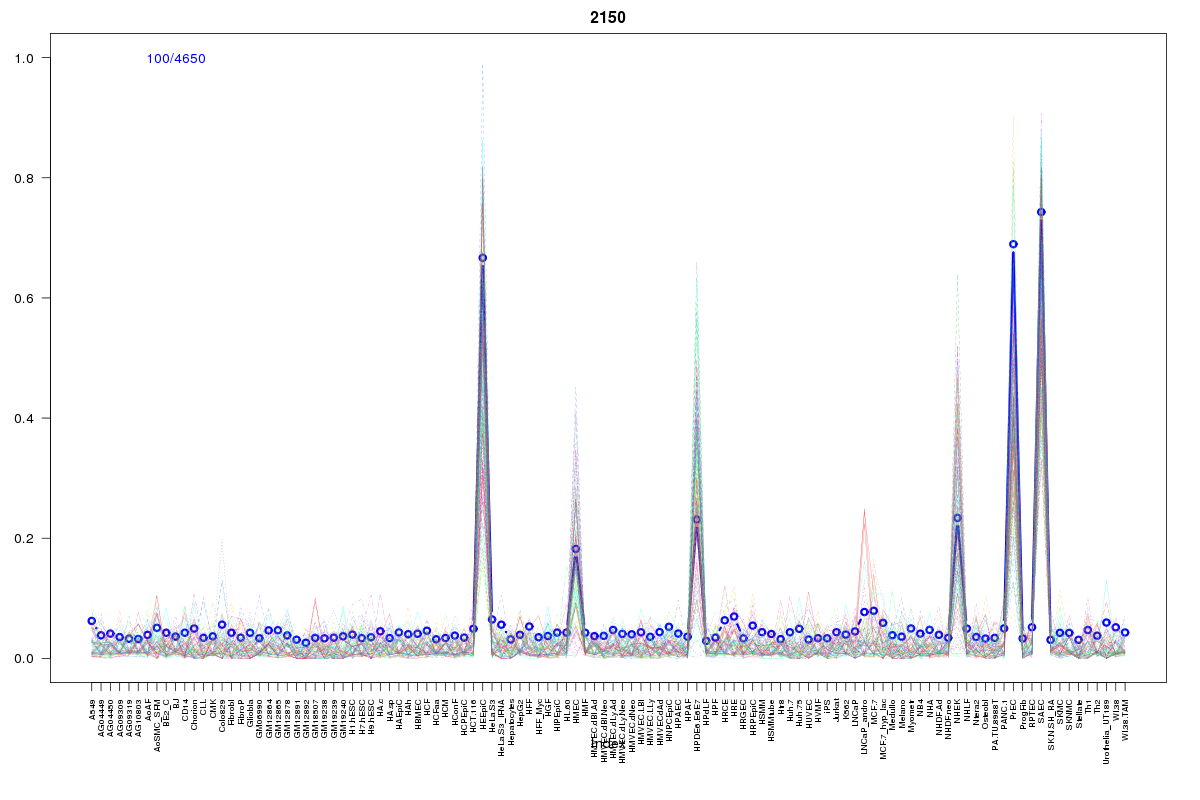 | 2150 | 1 |
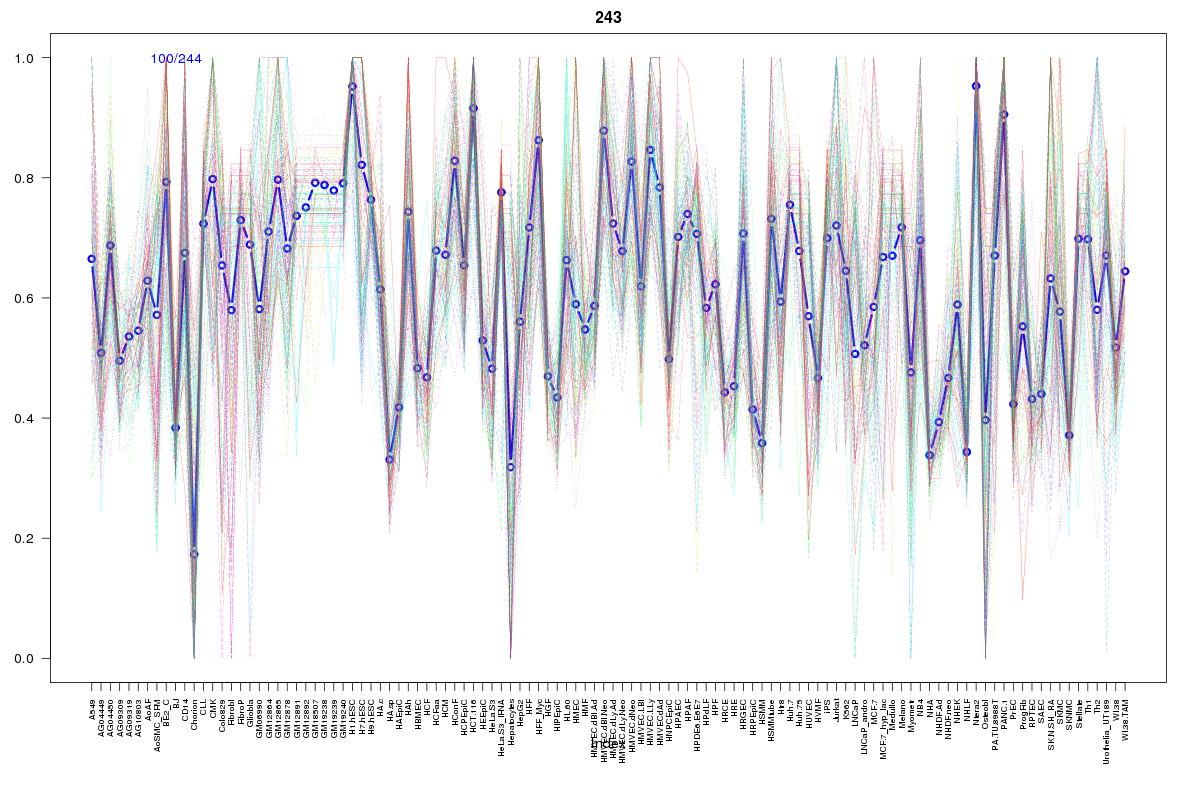 | 243 | 1 |
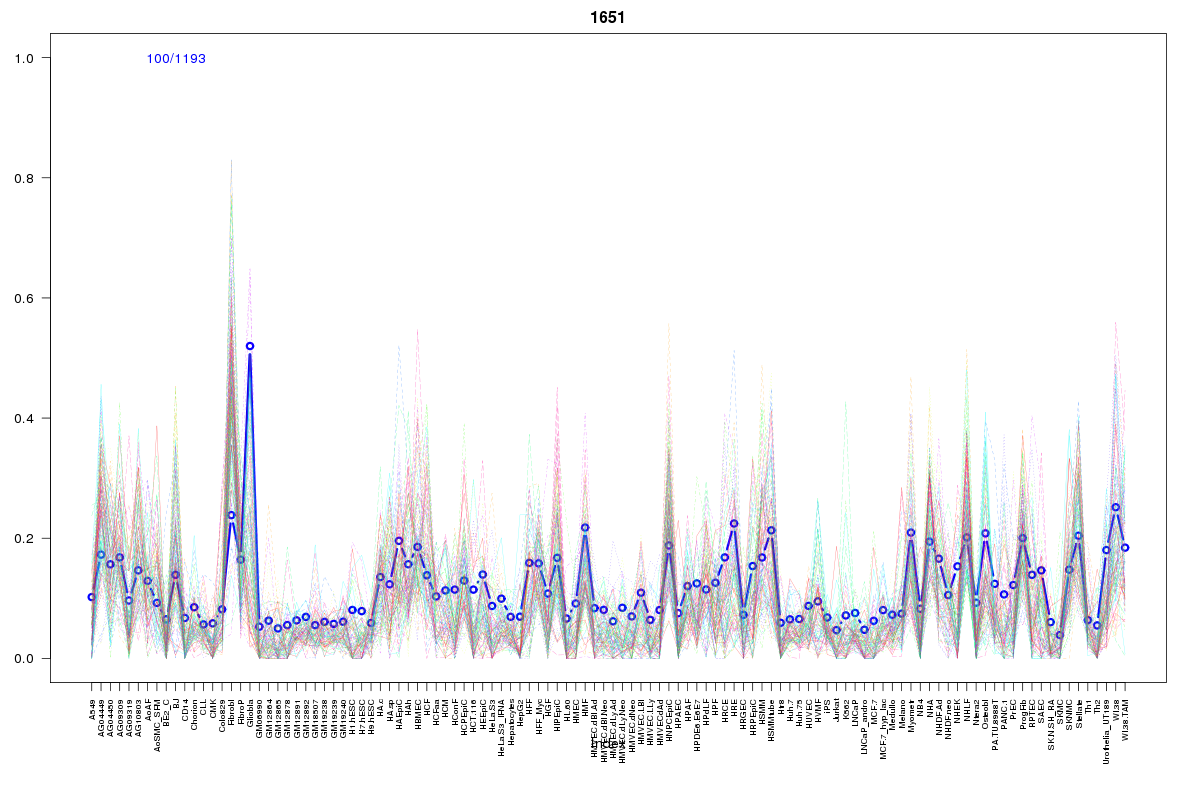 | 1651 | 1 |
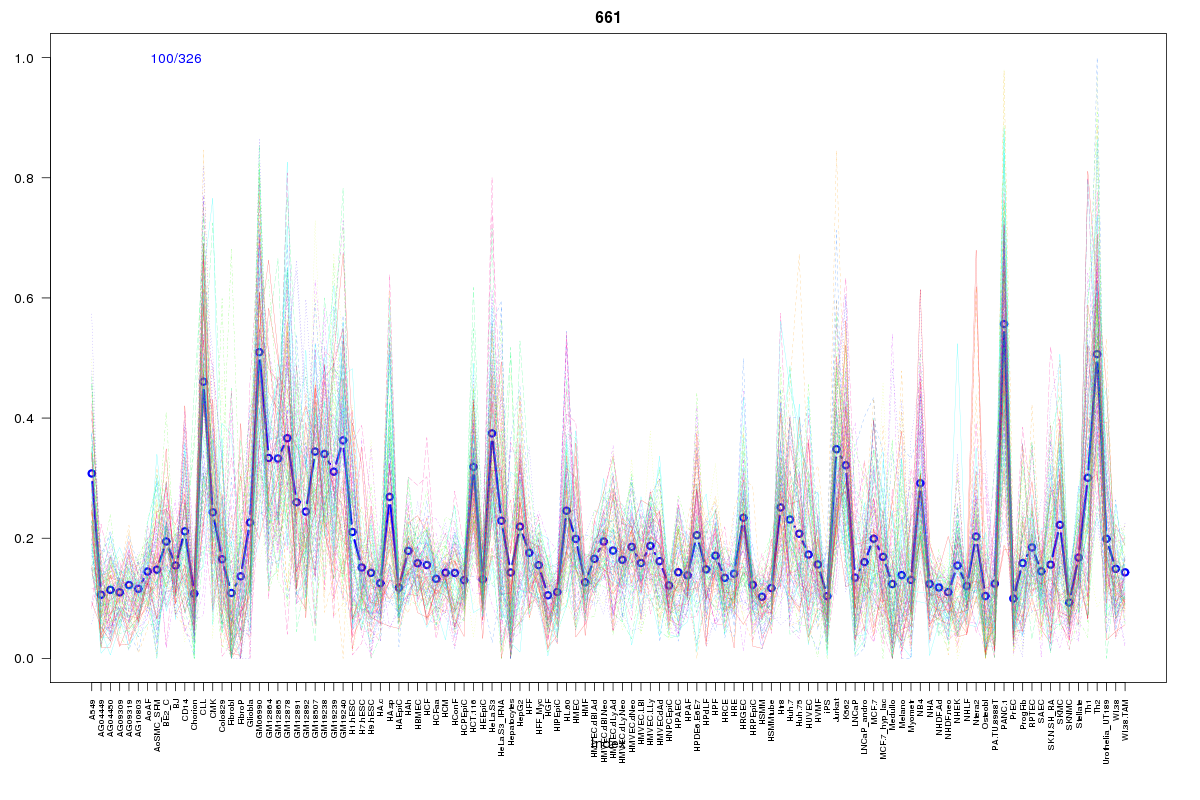 | 661 | 1 |
 | 2100 | 1 |
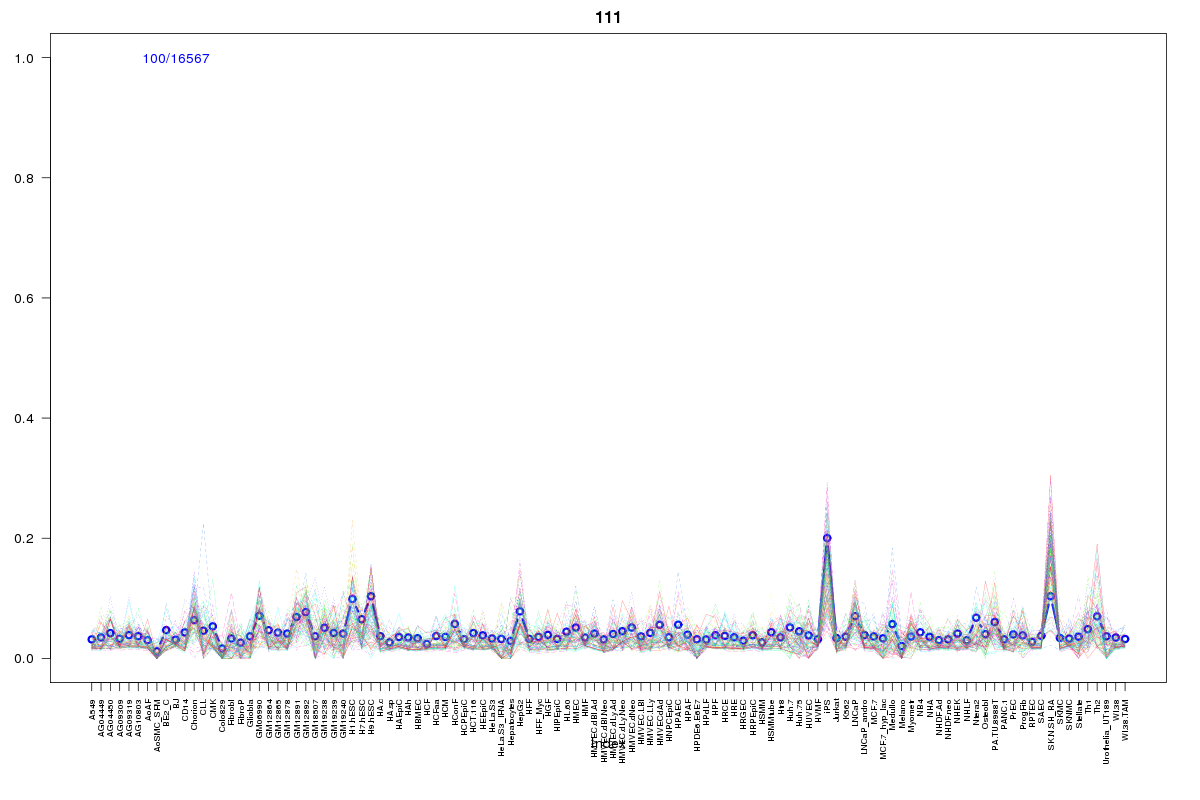 | 111 | 1 |
Resources
BED file downloads
Connects to 11 DHS sitesTop 10 Correlated DHS Sites
p-values indiciate significant higher or lower correlation| Location | Cluster | P-value |
|---|---|---|
| chr12:54013400-54013550 | 409 | 0.004 |
| chr12:54095660-54095810 | 243 | 0.005 |
| chr12:53983360-53983510 | 15 | 0.02 |
| chr12:54070600-54070750 | 1462 | 0.022 |
| chr12:54121680-54121830 | 661 | 0.023 |
| chr12:53969380-53969530 | 474 | 0.024 |
| chr12:54119705-54119855 | 1651 | 0.024 |
| chr12:54090845-54090995 | 2150 | 0.017 |
| chr12:54123560-54123710 | 2100 | 0.016 |
| chr12:54030345-54030495 | 1605 | 0.01 |
| chr12:54142725-54142875 | 111 | 0.009 |
External Databases
UCSCEnsembl (ENSG00000135390)