SOM cluster: 1462
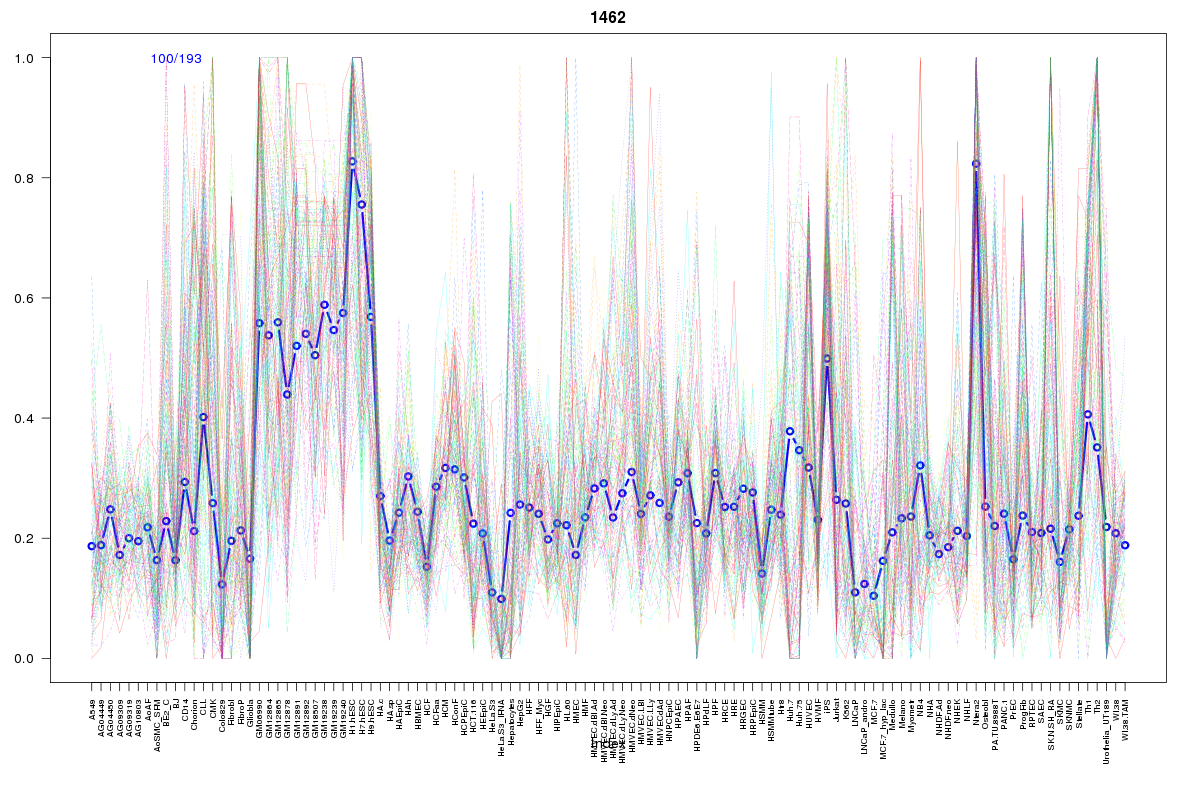
Cluster Hypersensitivity Profile

Genomic Location Trend
These plots show the distribution of the DHS sites surrounding the Transcript Start Site of the nearest gene.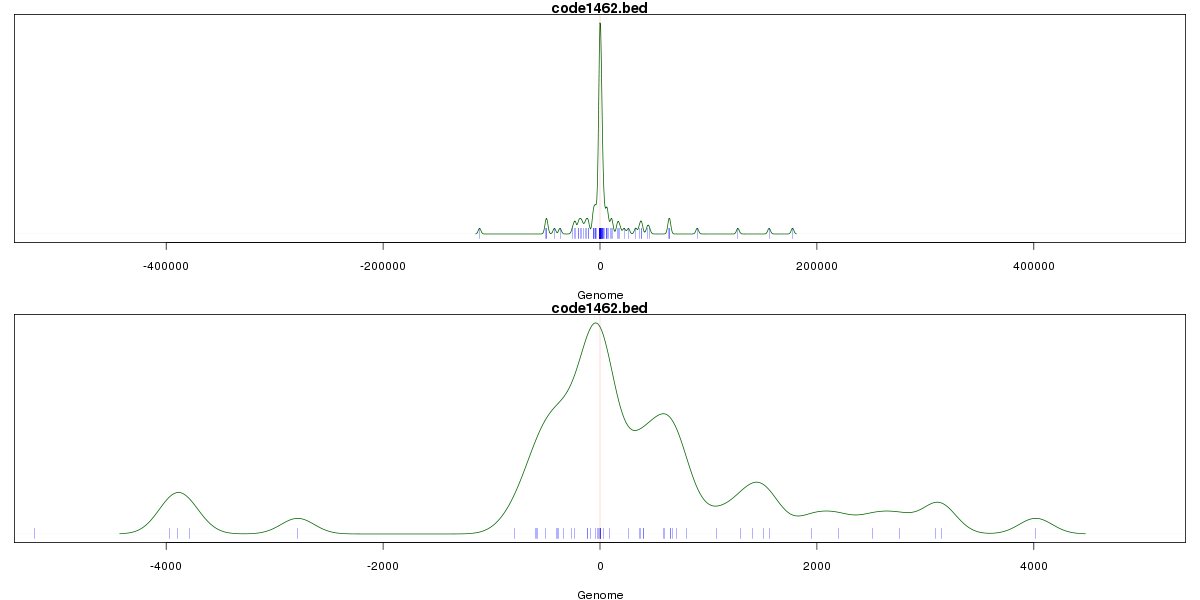
Stats
Number of sites: 193Promoter: 23%
CpG-Island: 61%
Conserved: 54%
Enriched Motifs & Matches
Match Detail: [Jaspar]
|
| ||
|---|---|---|
| Sites: 95/100 | e-val: 0 | ||
| Factor | e-val(match) | DB |
| SP1 | 0.00000000095331 | JASPAR |
| TFAP2A | 0.00047699 | JASPAR |
| PLAG1 | 0.0015768 | JASPAR |
| CTCF | 0.01633 | JASPAR |
| Egr1 | 0.01656 | JASPAR |
|
| ||
| Sites: 56/100 | e-val: 1.3e-24 | ||
| Factor | e-val(match) | DB |
| SP1 | 0.00029196 | JASPAR |
| TFAP2A | 0.0026923 | JASPAR |
| INSM1 | 0.003715 | JASPAR |
| Egr1 | 0.0054575 | JASPAR |
| CTCF | 0.014316 | JASPAR |
|
| ||
| Sites: 35/100 | e-val: 0.064 | ||
| Factor | e-val(match) | DB |
| SP1 | 0.000007222 | JASPAR |
| PLAG1 | 0.000014642 | JASPAR |
| CTCF | 0.0038375 | JASPAR |
| TFAP2A | 0.0060691 | JASPAR |
| INSM1 | 0.0061466 | JASPAR |
BED file downloads
Top 10 Example Regions
| Location | Gene Link | Dist. |
|---|---|---|
| chr2: 30454880-30455030 | LBH | 42.04 |
| chr2: 30454880-30455030 | AC104698.1 | 42.04 |
| chr22: 36851365-36851515 | EIF3D | 42.51 |
| chr22: 36851365-36851515 | RP5-1119A7.14 | 42.51 |
| chr6: 28956400-28956550 | KRT18P1 | 46.68 |
| chr6: 28956400-28956550 | HCG15 | 46.68 |
| chr1: 94081320-94081470 | RP5-1033H22.2 | 47.48 |
| chr5: 157078680-157078830 | AC008694.2 | 54.02 |
| chrX: 119443460-119443610 | EEF1A1P30 | 58.37 |
| chr12: 6756540-6756690 | ACRBP | 59.06 |