Gene: EPC1
chr10: 32556678-32667726Expression Profile
(log scale)
Graphical Connections
Distribution of linked clusters:
You may find it interesting if many of the connected DHS sites belong to the same cluster.| Cluster Profile | Cluster ID | Number of DHS sites in this cluster |
|---|---|---|
 | 687 | 2 |
 | 2017 | 1 |
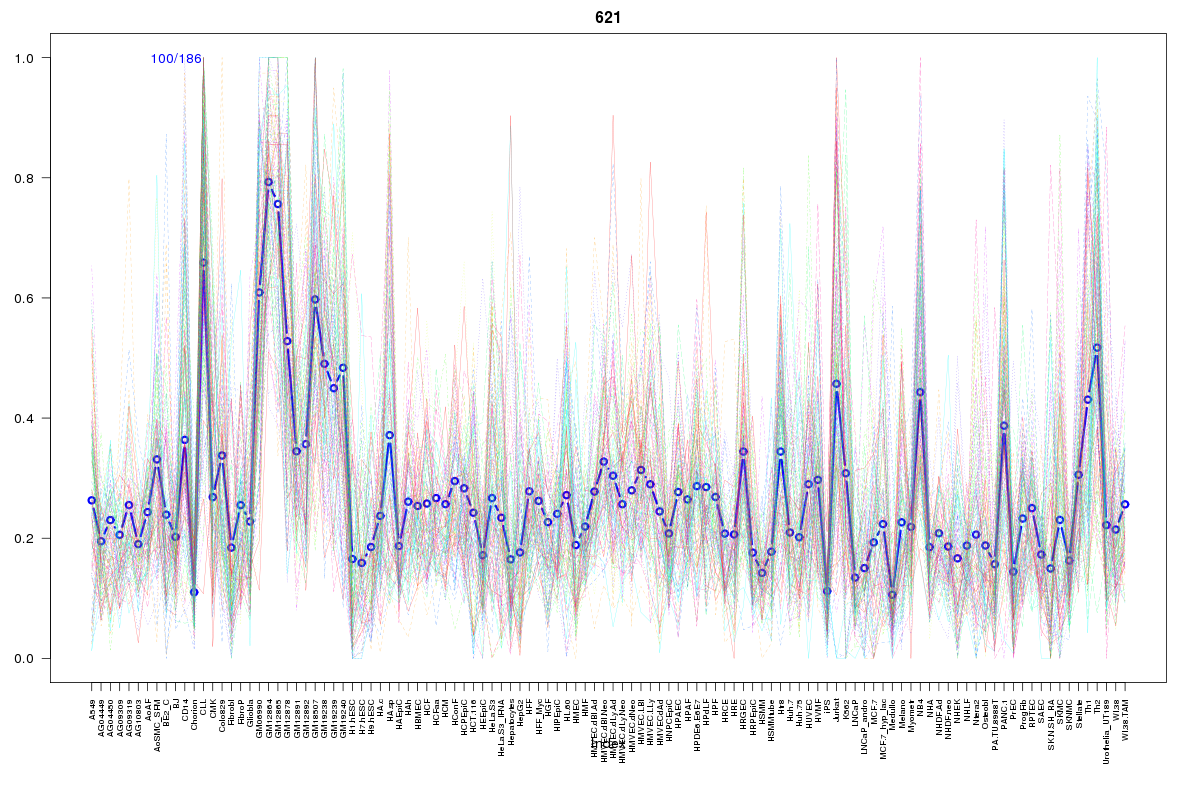 | 621 | 1 |
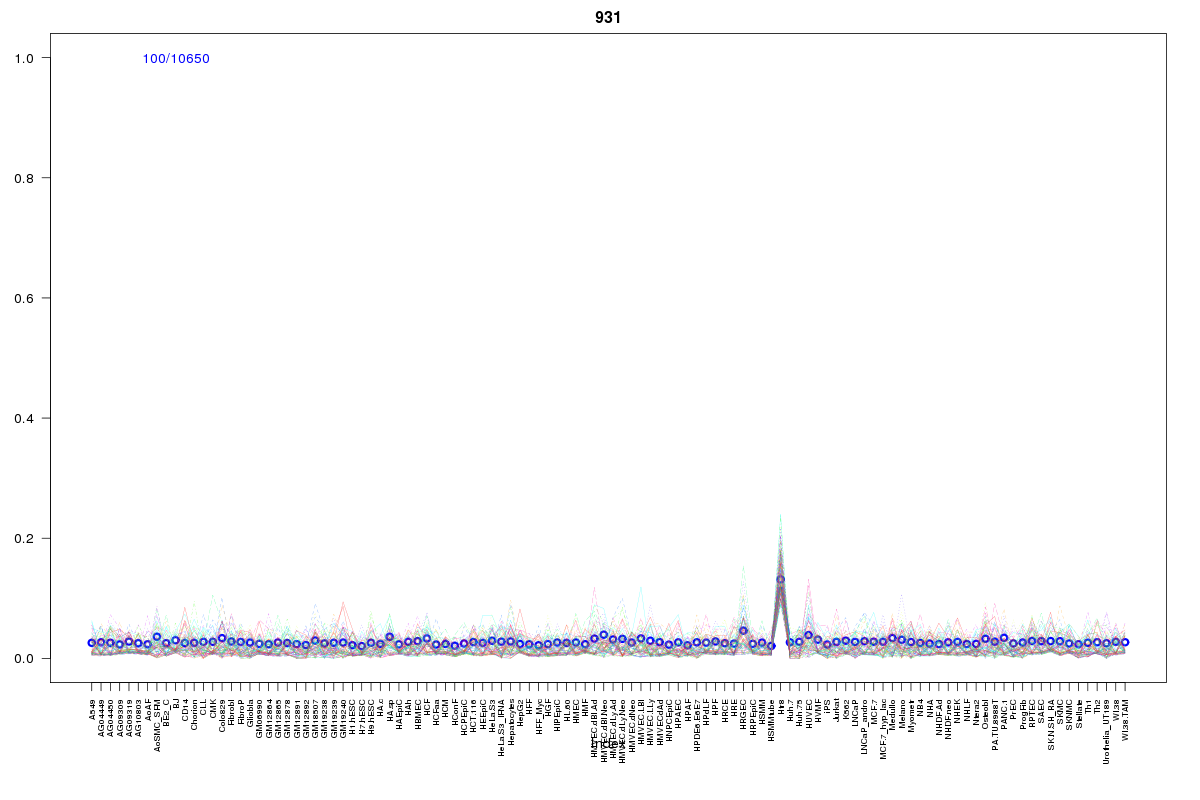 | 931 | 1 |
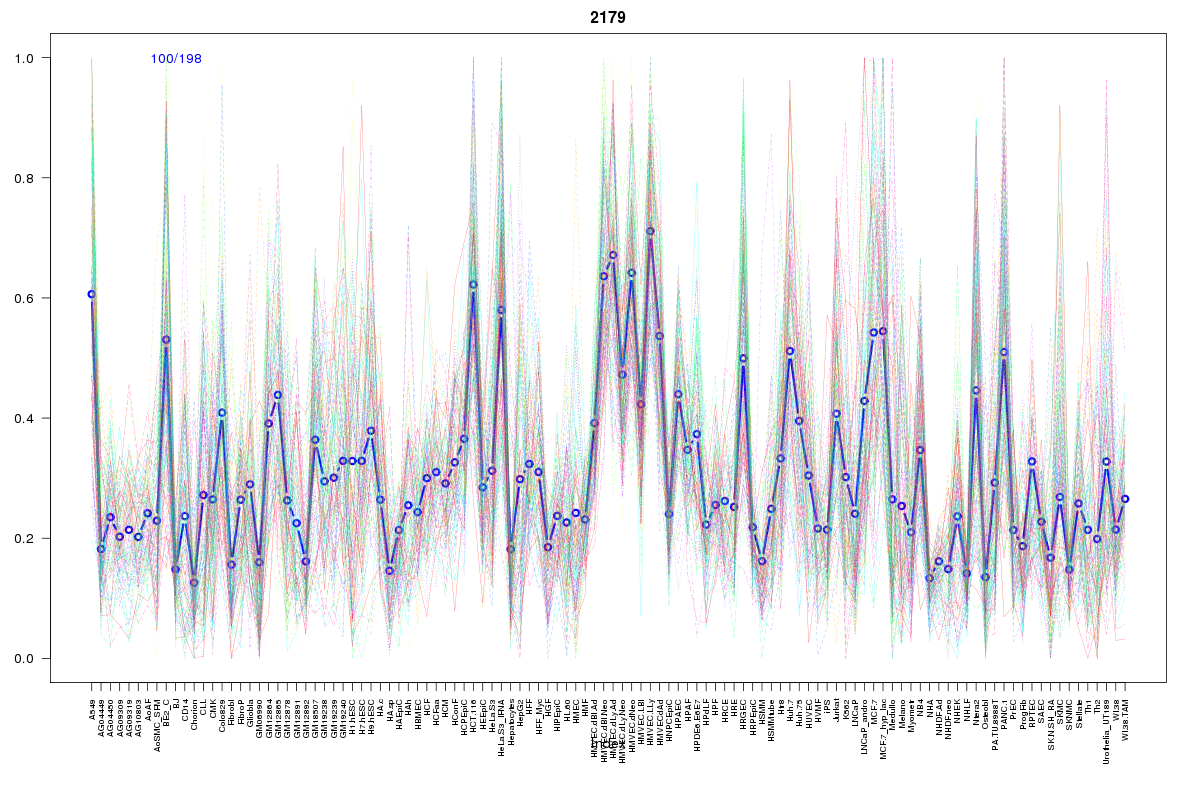 | 2179 | 1 |
 | 2055 | 1 |
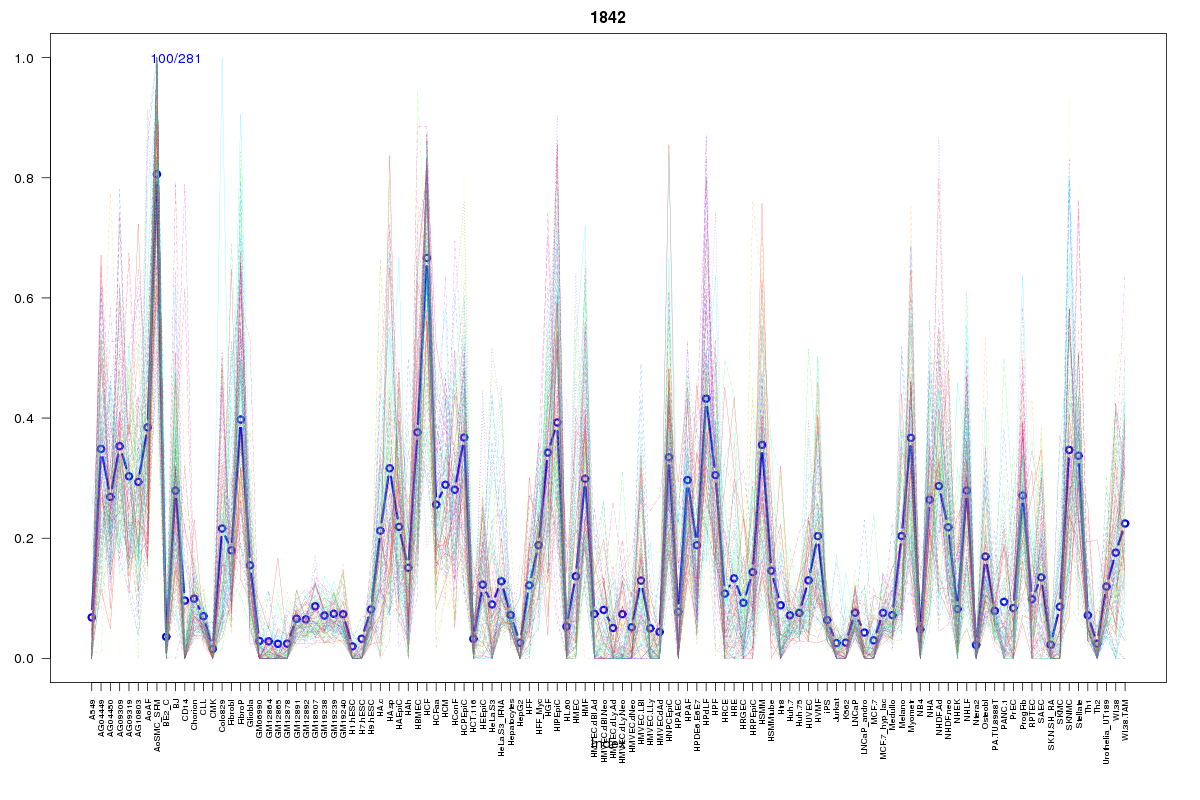 | 1842 | 1 |
 | 2068 | 1 |
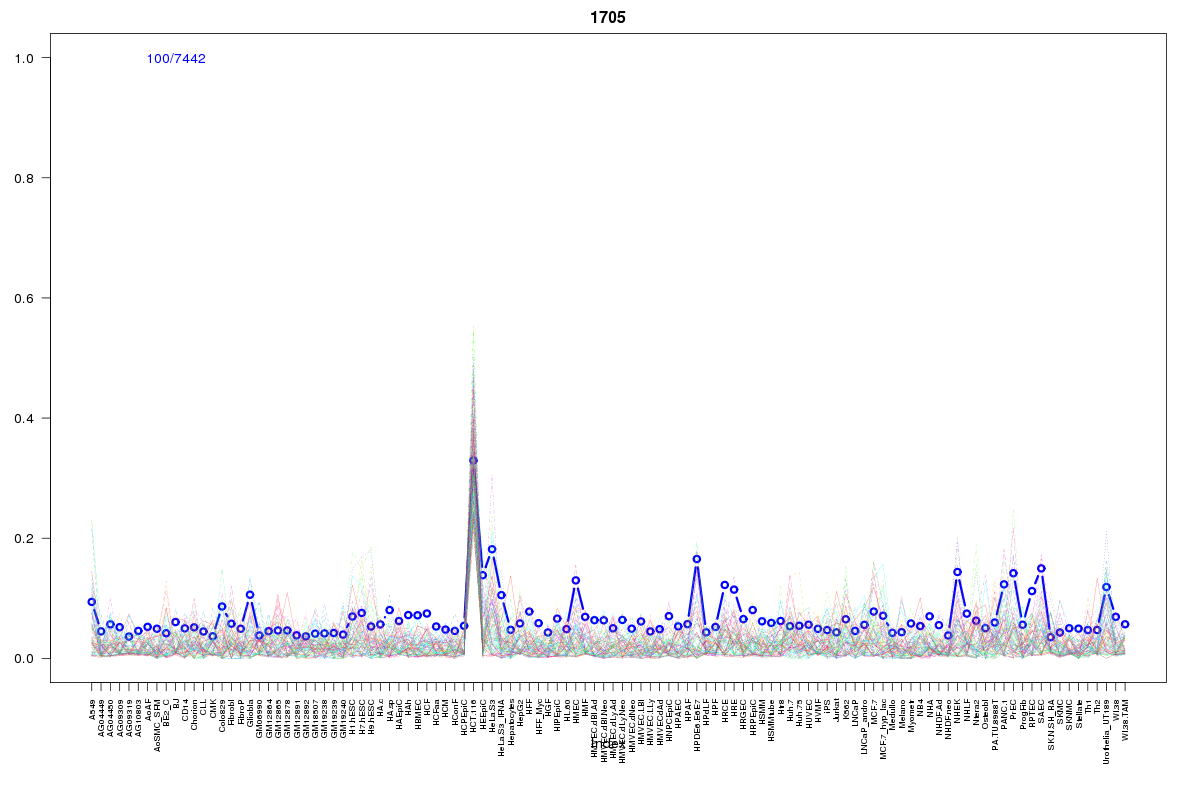 | 1705 | 1 |
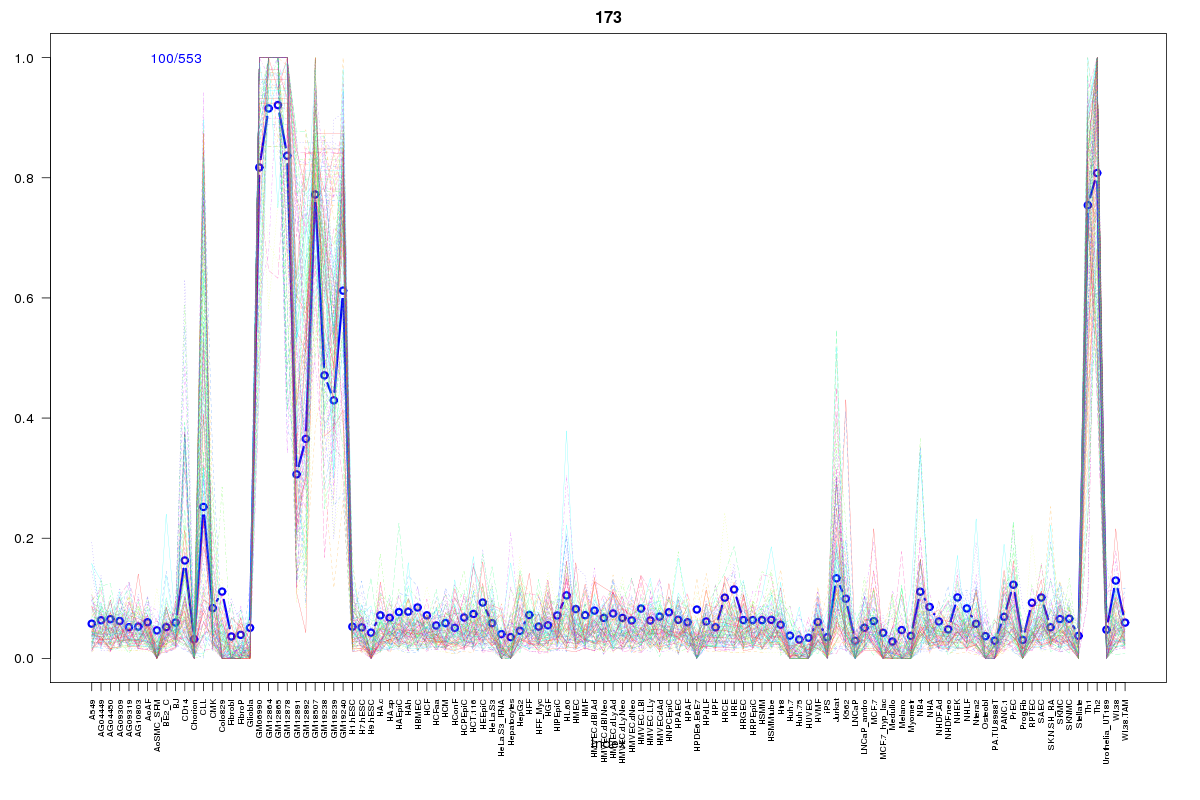 | 173 | 1 |
 | 569 | 1 |
 | 1230 | 1 |
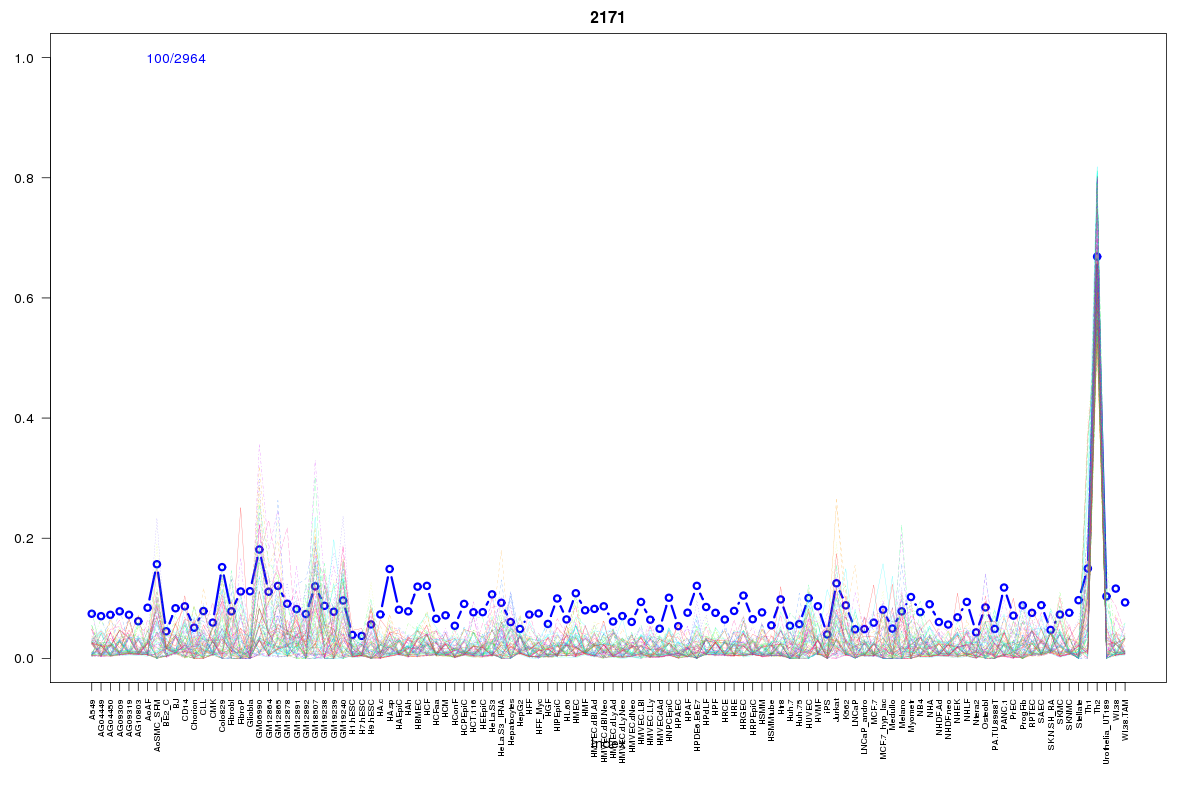 | 2171 | 1 |
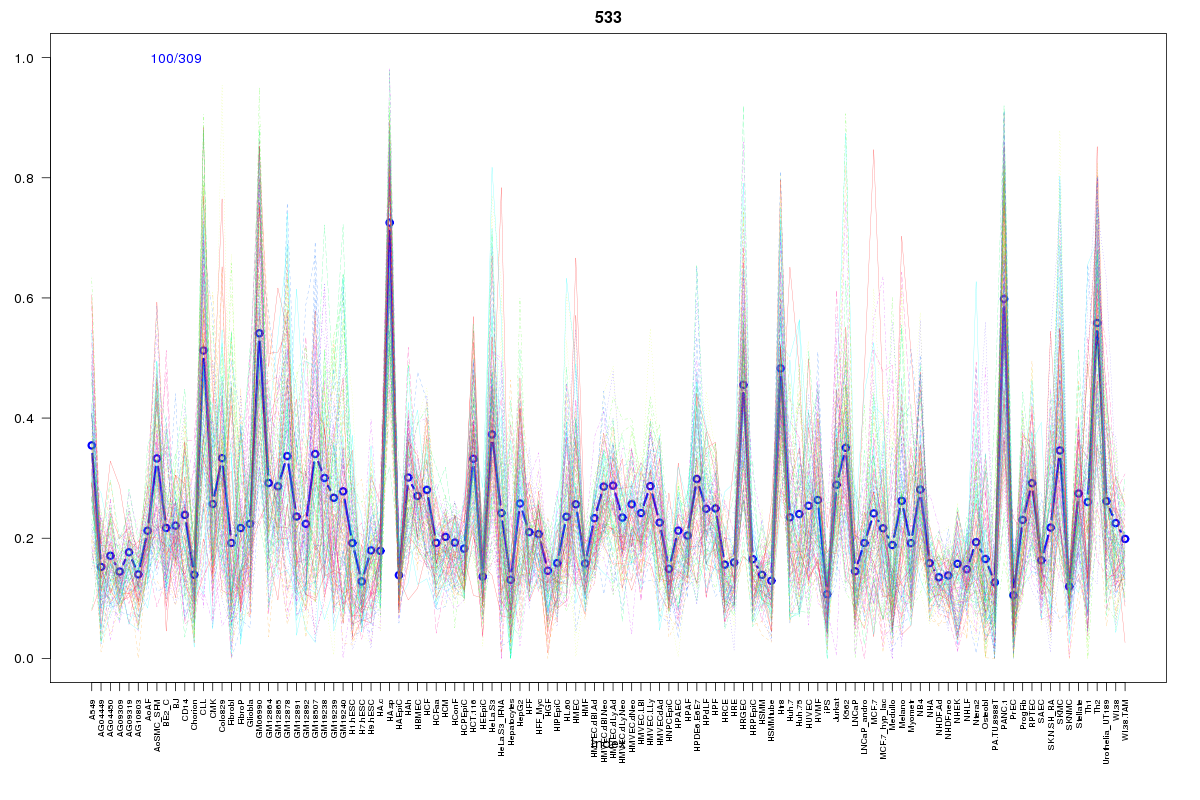 | 533 | 1 |
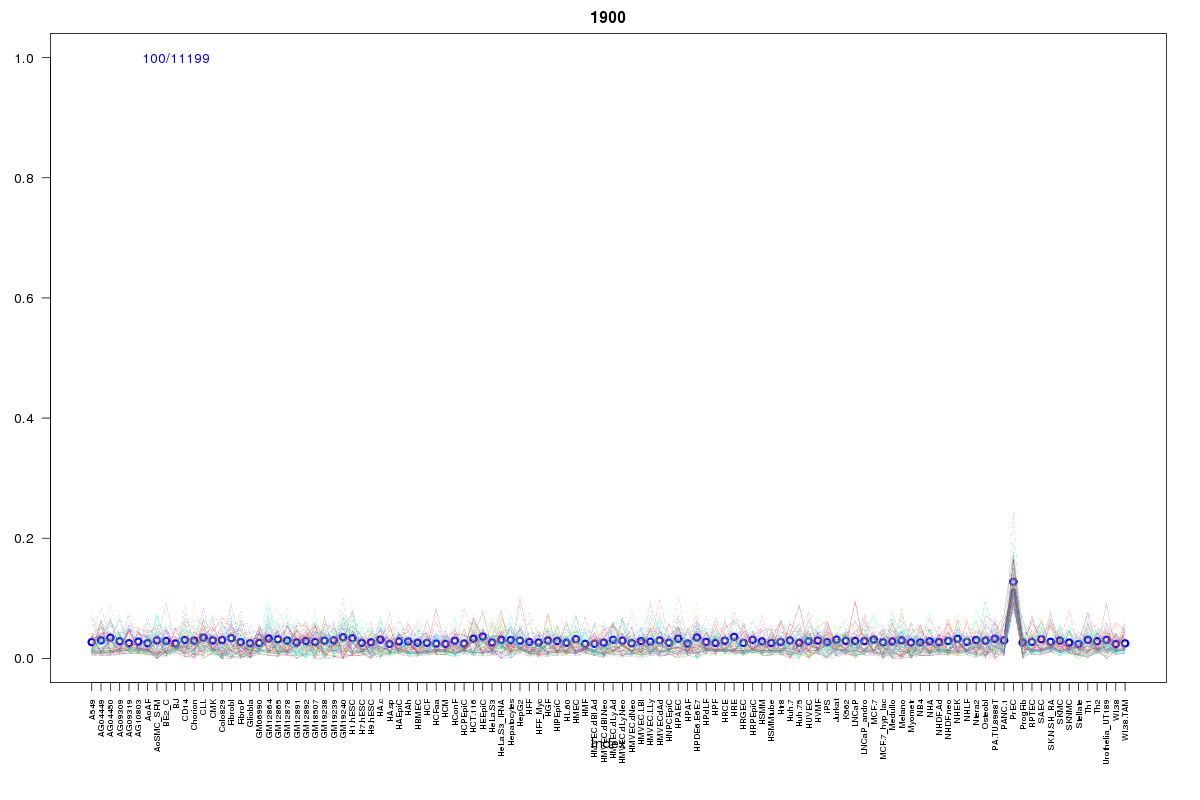 | 1900 | 1 |
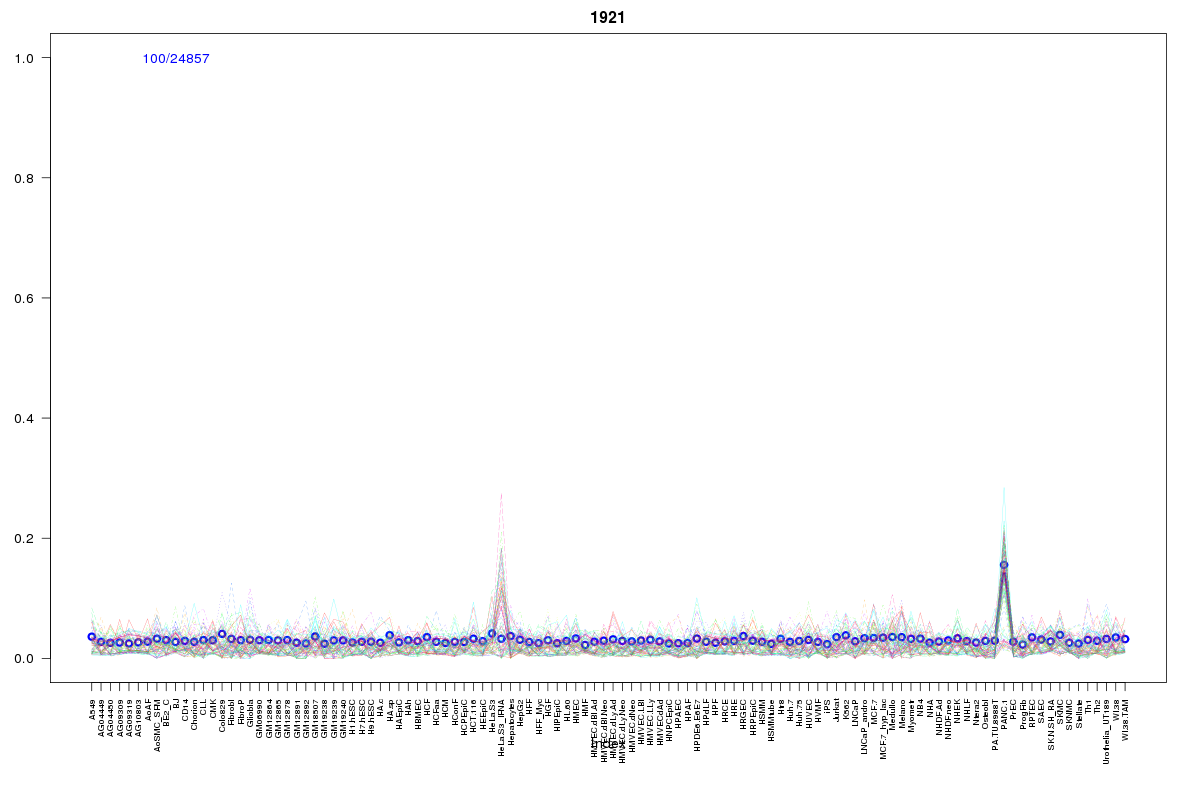 | 1921 | 1 |
Resources
BED file downloads
Connects to 17 DHS sitesTop 10 Correlated DHS Sites
p-values indiciate significant higher or lower correlation| Location | Cluster | P-value |
|---|---|---|
| chr10:32496580-32496730 | 2179 | 0.01 |
| chr10:32655565-32655715 | 687 | 0.01 |
| chr10:32479660-32479810 | 2017 | 0.01 |
| chr10:32513265-32513415 | 2055 | 0.01 |
| chr10:32479900-32480050 | 621 | 0.012 |
| chr10:32606880-32607030 | 173 | 0.013 |
| chr10:32641405-32641555 | 687 | 0.013 |
| chr10:32533525-32533675 | 2068 | 0.014 |
| chr10:32643985-32644135 | 1230 | 0.018 |
| chr10:32546120-32546270 | 1705 | 0.018 |
| chr10:32666640-32666790 | 533 | 0.021 |
External Databases
UCSCEnsembl (ENSG00000120616)