SOM cluster: 621
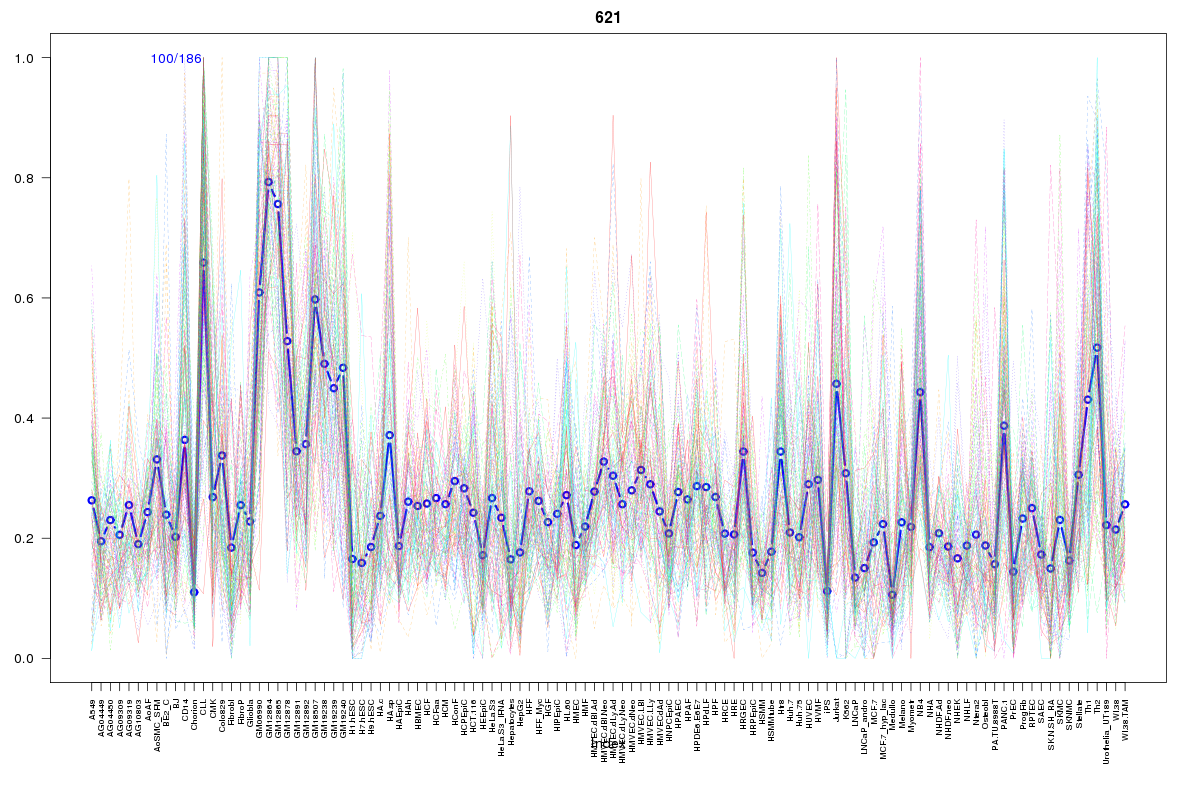
Cluster Hypersensitivity Profile

Genomic Location Trend
These plots show the distribution of the DHS sites surrounding the Transcript Start Site of the nearest gene.
Stats
Number of sites: 186Promoter: 45%
CpG-Island: 17%
Conserved: 39%
Enriched Motifs & Matches
Match Detail: [Jaspar]
|
| ||
|---|---|---|
| Sites: 37/100 | e-val: 0.000000000071 | ||
| Factor | e-val(match) | DB |
| IRF1 | 0.000000000002488 | JASPAR |
| IRF2 | 0.000000000034918 | JASPAR |
| FOXF2 | 0.0024711 | JASPAR |
| SRY | 0.013496 | JASPAR |
| FOXA1 | 0.020382 | JASPAR |
BED file downloads
Top 10 Example Regions
| Location | Gene Link | Dist. |
|---|---|---|
| chr1: 145589600-145589750 | RBM8A | 17.66 |
| chr1: 145589600-145589750 | POLR3C | 17.66 |
| chr1: 145589600-145589750 | NUDT17 | 17.66 |
| chr12: 4430700-4430850 | RP11-264F23.1 | 41.89 |
| chr10: 124740300-124740450 | IKZF5 | 54.55 |
| chr10: 124740300-124740450 | FAM24A | 54.55 |
| chr12: 72149220-72149370 | TMEM19 | 56.06 |
| chr12: 72149220-72149370 | RP11-293I14.2 | 56.06 |
| chr12: 72149220-72149370 | ZFC3H1 | 56.06 |
| chr12: 14923660-14923810 | HIST4H4 | 56.11 |